
If you averaged all the people living in the United States where would the center of population be?
The U.S. Census Bureau calculates the center of population in two ways: mean and median center of population.
What is the mean center of population?
Every ten years, after the decennial census, the U.S. Census Bureau calculates the location that represents “the point at which an imaginary, weightless, rigid, and flat (no elevation effects) surface representation of the 50 states (or 48 conterminous states for calculations made prior to 1960) and the District of Columbia would balance if weights of identical size were placed on it so that each weight represented the location on one person.”
What is the median center of population?
The median population is the location in the United States that splits the country into two sections. The first splits the total population in a north and south half. This means that at the median center, half of the U.S populations lives north of that latitude, and half of the population lives south of that latitude.
The second split is an east-west split. This means that at that location, half of the U.S. population lives west of that point of longitude, and half of the population lives east of that location.
Historical U.S. Census counts
As the population of the United States has risen, and the Federal government has made an effort to include Native American residents, the mean center of the country’s population has shifted westward.
The U.S. Censuses held between 1790 and 1840 didn’t not, for the most part, include counts of Native Americans, skewing the results eastward towards the European settlements that began in the New England area of the United States.
Even in the modern census counts, there are still areas of the country where the population is undercounted or overcounted. For the 2020 Census, Black, Latino, and American Indian and Alaska Native populations were statistically undercounted.
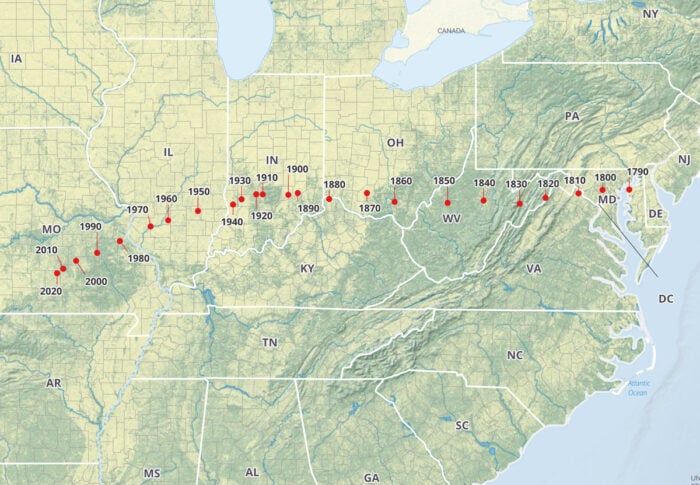
Map of the mean center of population from 1790 to 2020
This map uses data provided by the U.S. Census Bureau to show the geographic shift in the mean center of population for the United States over time.
With each decennial census, the mean center of population shifts westward.

Table: mean center of population for the United States, 1790 – 2020
| Census Year | Latitude | Longitude | Approximate Location |
| 2020 | 37.415725 | -92.346525 | Wright County, MO, 14.6 miles northeast of Hartville |
| 2010 | 37.517534 | -92.173096 | Texas County, MO, 2.7 miles northeast of Plato |
| 2000 | 37.69699 | -91.80957 | Phelps County, MO, 2.8 miles east of Edgar Springs |
| 1990 | 37.87222 | -91.21528 | Crawford County, MO, 9.7 miles southeast of Steelville |
| 1980 | 38.13694 | -90.57389 | Jefferson County, MO, 1/4 mile west of DeSoto |
| 1970 | 38.46306 | -89.70611 | St. Clair County, IL, 5 miles east-southeast of Mascoutah |
| 1960 | 38.59944 | -89.20972 | Clinton County, IL, 6 1/2 miles northwest of Centralia |
| 1950 | 38.80417 | -88.36889 | Clay County, IL, 3 miles northeast of Louisville |
| 1940 | 38.94833 | -87.37639 | Sullivan County, IN, 2 mile southeast by east of Carlisle |
| 1930 | 39.0625 | -87.135 | Greene County, IN, 3 miles northeast of Linton |
| 1920 | 39.1725 | -86.72083 | Owen County, IN, 8 miles south-southeast of Spencer |
| 1910 | 39.17 | -86.53889 | Monroe County, IN, in the city of Bloomington |
| 1900 | 39.16 | -85.815 | Bartholomew County, IN, 6 miles southeast of Columbus |
| 1890 | 39.19889 | -85.54806 | Decatur County, IN, 20 miles east of Columbus |
| 1880 | 39.06889 | -84.66111 | Boone County, KY, 8 mile west by south of Cincinnati, OH |
| 1870 | 39.2 | -83.595 | Highland County, OH, 48 miles east by north of Cincinnati |
| 1860 | 39.00667 | -82.81333 | Pike County, OH, 20 miles south by east of Chillicothe |
| 1850 | 38.98333 | -81.31667 | Wirt County, WV, 23 miles southeast of Parkersburg2 |
| 1840 | 39.03333 | -80.3 | Upshur County, WV, 16 miles south of Clarksburg. |
| 1830 | 38.965 | -79.28167 | Grant County, WV, 19 miles west-southwest of Morefiled. |
| 1820 | 39.095 | -78.55 | Hardy County, WV, 16 mile east of Moorefield2 |
| 1810 | 39.19167 | -77.62 | Loudoun County, VA, 40 miles northwest by west of Washington, DC |
| 1800 | 39.26833 | -76.94167 | Howard County, MD, 18 miles west of Baltimore. |
| 1790 | 39.275 | -76.18667 | Kent County, MD, 23 miles east of Baltimore |
Map: Median Center of Population for the United States: 1880 to 2020
This map created by the U.S. Census Bureau shows how the median center of population has shifted with each decennial census starting with 1880 up to 2020.

Read next: What is the Geographic Center of the United States?
References
African Americans and the Federal Census, 1790–1930. (2012, July). National Archives and Records Administration. https://www.archives.gov/files/research/census/african-american/census-1790-1930.pdf
American Indians in the federal decennial census, 1790-1930. (2017, June 26). National Archives. https://www.archives.gov/research/census/native-americans/1790-1930.html
US Census Bureau. (2021, November 16). Position of the geographic center of area, mean and median centers of population: 2020. Census.gov. https://www.census.gov/library/visualizations/2020/geo/geographic-center-2020.html