If you have a text file with latitude and longitude coordinates in decimal degrees or degrees minutes seconds format, you can easily add these as a point layer in QGIS.
This quick QGIS tutorial takes you through the steps of how to add a CSV file with latitude and longitude coordinates.
For this tutorial, I will be adding points for the mean center of population of the United States from 1790 to 2020.
The latitude and longitude coordinates for these mean centers of population are stored in a CSV file which is a comma delineated text file.
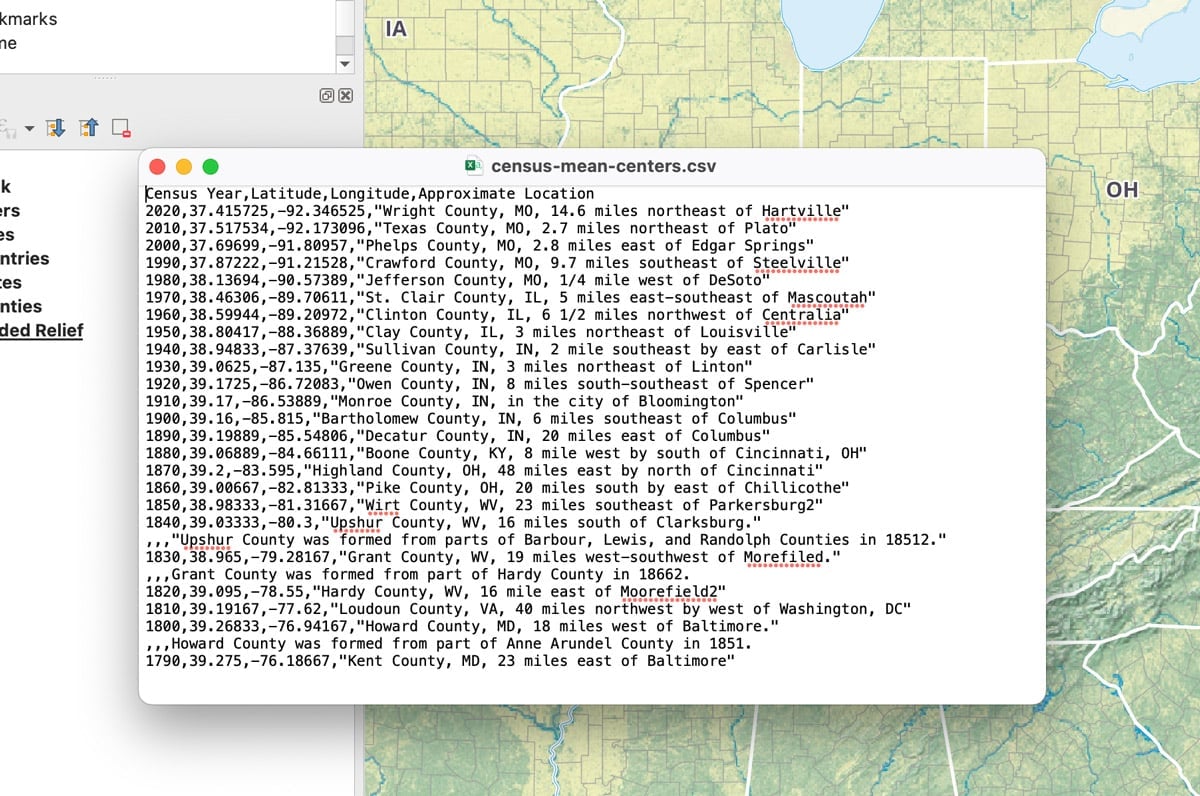
Adding a CSV file to QGIS
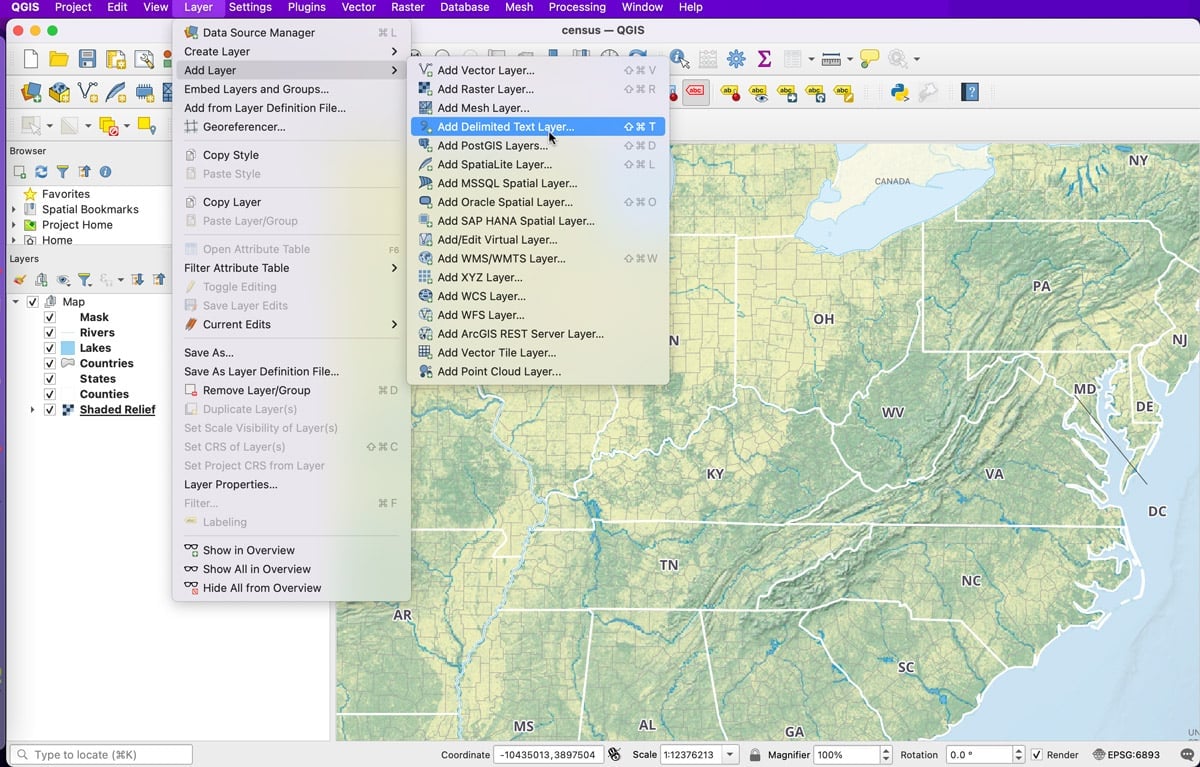
First, add the CSV file to an open QGIS project file. To do this go to Layer –> Add Layer –> Add Delimited Text Layer from the menu.
In the Data Source Manager interface that pops up, select the three vertical dots to right of the white box for the File name and navigate to the folder on the computer to where the CSV file is stored.
Once the file is elected, the Sample Data box at the bottom of the interface will populate with some of the data from the CSV file.
If your column names for the latitude and longitude coordinates are labeled as such, QGIS will automatically assign then to the X field and Y field parameters. If not, select fields for the longitude values (X) and the latitude values (Y).
The latitude and longitude values for the mean center of population CSV file are in decimal degrees so in this case the DMS coordinates box is left unchecked. If you have a text file that has the coordinates in DMS (degrees minutes seconds) then check the box.
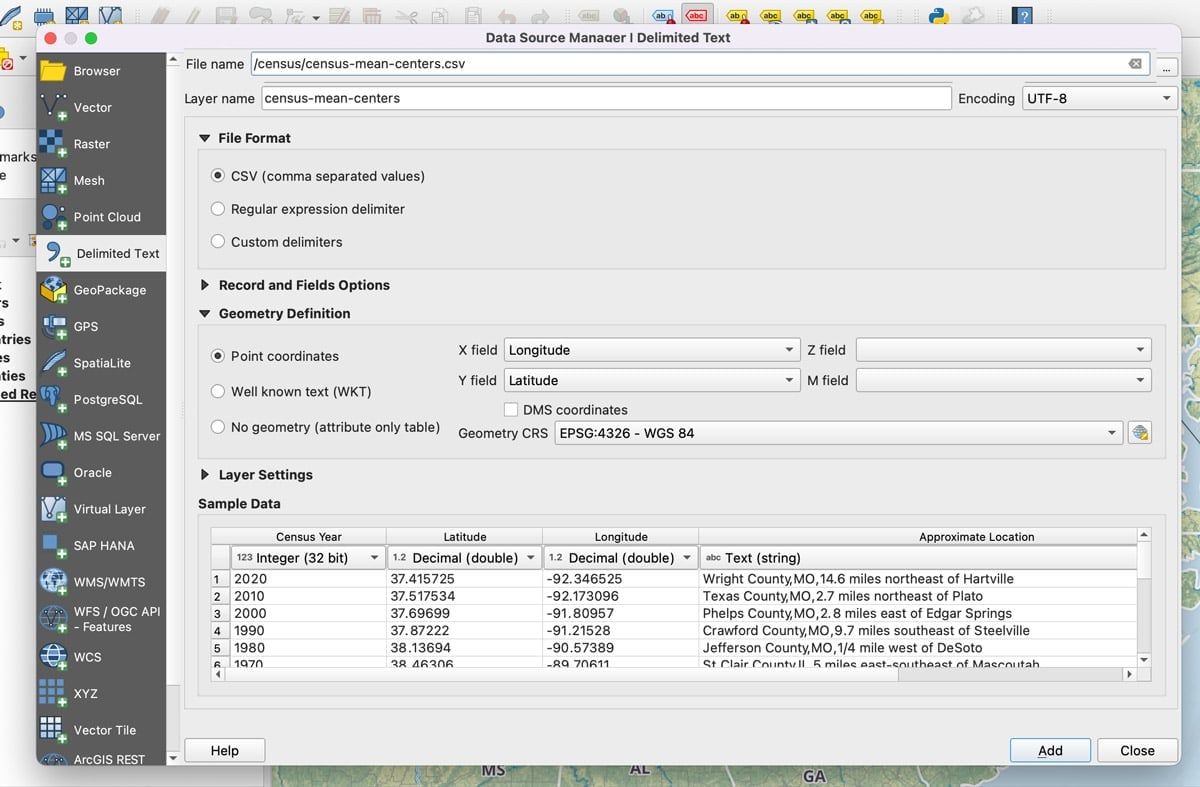
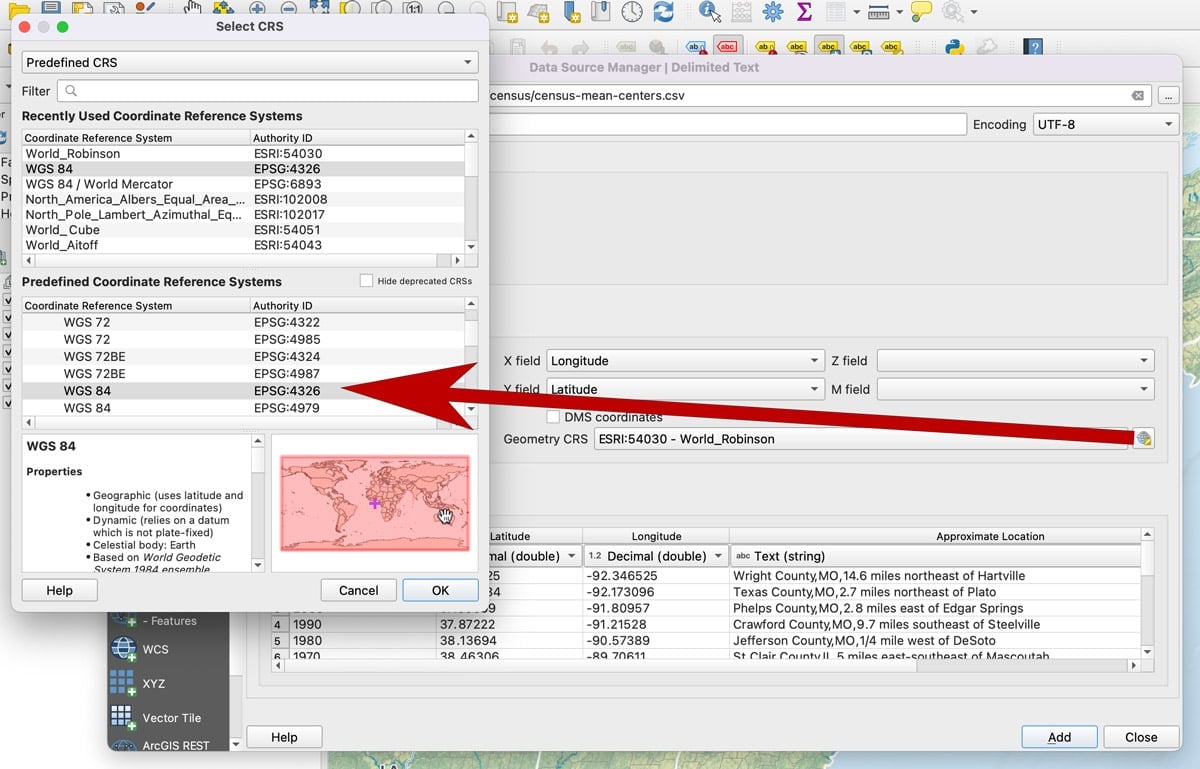
Next, it’s important to tell QGIS what the Coordinate reference system (CRS) is for the coordinates. QGIS defaults the CRS to that of the project. With the latitude and longitude coordinates in decimal degrees, the CRS needs to be set to WGS 84 (EPSG: 4326).
To do this, click on the tiny globe icon located to the right of the drop down menu for Geometry CRS. From the CRS list, select WGS 84 and hit the “OK” button.
Now that the parameters have been set for the CSV file, it’s time to click the “add” button. A new point layer containing the attribute information found in the CSV file will be added to the QGIS project layers.
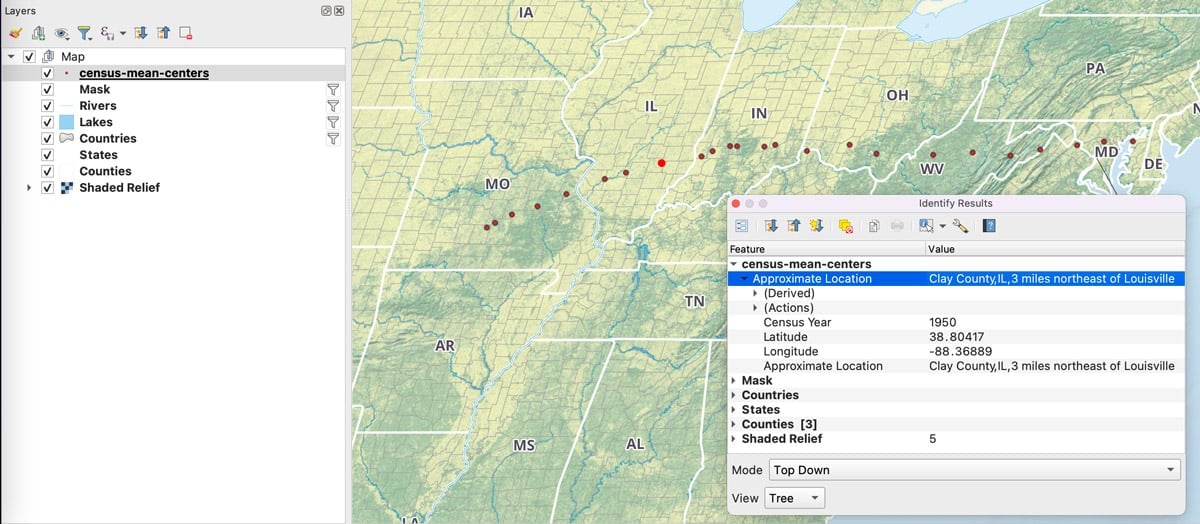
Troubleshooting any mapping issues with the CSV file in QGIS
If you have added your CSV file and the points are not showing up where you expect them to be you can check for three things.
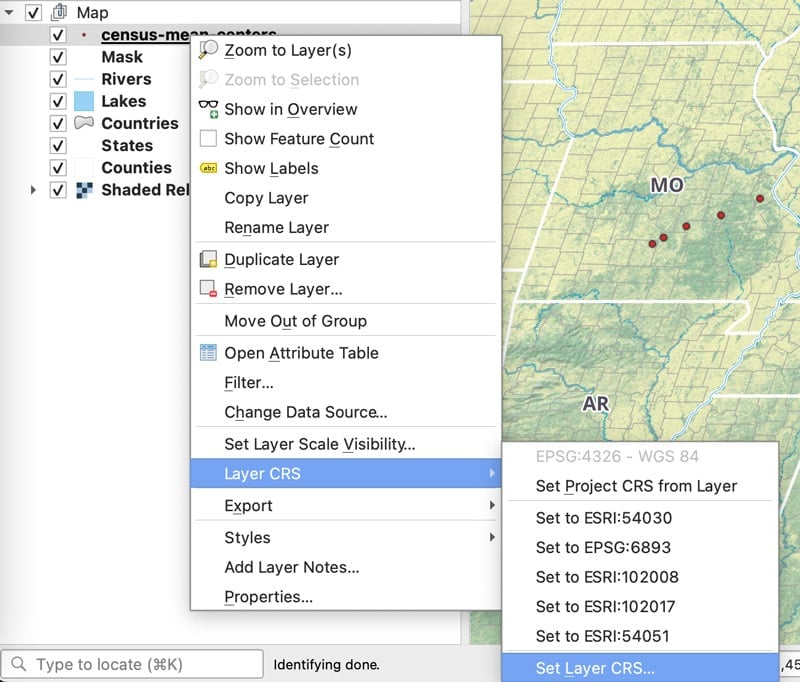
First, make sure that you set the Geometry CRS to WGS 84 before you added the CSV file. If you forgot, you can always fix this after the layer has been added to your QGIS project.
To change the CRS, right-click on the layer and then navigate to Layer CRS –> Set Layer CRS. This will bring back up the same interface for selecting a CRS and you can then select WGS 84.
Make sure the EPSG code is 4326 as there are other projections with WGS 84 listed.
The second main reason why your points are not mapped where they should be is because the decimal degree coordinates may be missing the negative sign.
The mean centers of population table on the U.S. Census site lists the decimal degrees coordinates as positive numbers. If you were to extract these values and add them into a QGIS project, you will find your data mapped to Indonesia.
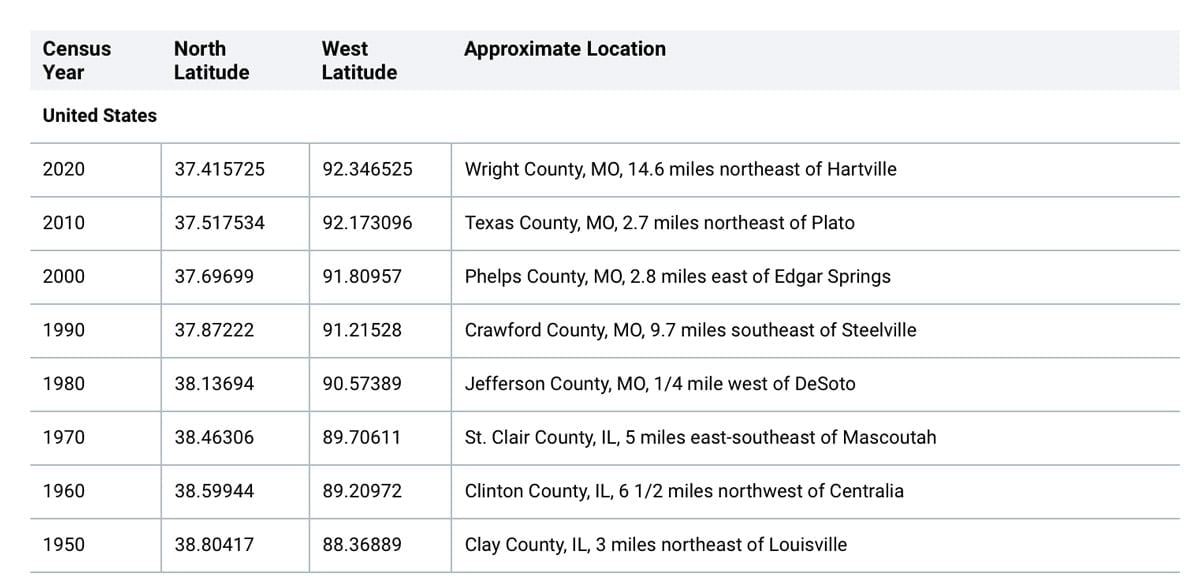
The reason for this is because with decimal degrees, latitudes that are positive are north of the equator and those that are negative are south of the equator. Longitudes that are positive are east of the Prime Meridian and those that are negative are west of the Prime Meridian.
Since the data is cover a geographic area in the United States with is west of the Prime Meridian that runs through Greenwhich, England, the longitude values need to be negative. You may also notice from the table, that there is a typo in that the longitude values are in a column called “West latitude” instead of “West longitude”.
This brings us to the third reason why your CSV file may not map the points in the proper geographic location: the X and Y values are switched. It’s common to see latitude listed as the first coordinate and longitude as the second coordinate when reading decimal degrees. This can be confusing since we also commonly refer to coordinates as “X and Y coordinates”.
So, a common mistake can be switching the columns so that X is assigned for the latitude coordinates and Y is assigned to the longitude coordinates. So, double check to make sure that you have assigned longitude as the X coordinates and latitude as the Y coordinates.
