
Michael Shillenn discusses how LiDAR data is being used to develop highly accurate elevation-enabled flood inundation mapping in advance of major storms in North Carolina.
When hurricanes or torrential rainstorms approach, will your government agency have enough insight about the local geography to publish potential flooding scenarios, issue accurate evacuation notices, and protect life and property? If they are using 3D elevation data acquired by high-quality light detection and ranging (LiDAR), then the answer is probably yes.
The problem, though, is that while high-resolution elevation mapping data is a valuable tool, it can be cost prohibitive to acquire. To encourage geospatial data collection, maximize investments and foster information sharing, the United States Geological Survey (USGS) launched the 3D Elevation Program (3DEP) three years ago. 3DEP is designed to foster partnerships among groups with common geospatial needs, using LiDAR to acquire detailed topographic data and a wide range of other 3-D representations of natural and constructed features.
North Carolina is the first state to map its entire area with high-resolution LiDAR, both from the air and by land, using its own resources and 3-DEP partnerships. And the state continues to systematically update its LiDAR data to reflect changes to the built environment and terrain. By collecting and analyzing this elevation data, state officials have valuable information to assist in disaster preparedness and planning. The state uses LiDAR data to model hazards, identify vulnerabilities and perform impact assessments on buildings, as well as natural resources.
Most impressive, perhaps, is how accurately North Carolina can calculate anticipated flooding when hurricanes approach, which enables officials to offer precise guidance on evacuations and assist in emergency response.
At an October 2017 USGS Coalition briefing in Washington, D.C., John Dorman, the assistant state EM director for Risk Management and director for the North Carolina Floodplain Mapping Program, shared how his organization is using LiDAR data to support elevation-enabled flood inundation mapping in advance of major storms, and produce highly accurate models, determining within a few feet which buildings would flood and which would not.
From the elevation data acquired, the state has been able to generate a high-resolution inventory of rivers and streams, geocoded more than 5.2 million buildings, calculated first floor elevations for the buildings and produced 13,000 flood map panels. Leveraging the LiDAR data, the state also has been able to seamlessly understand the exact amount of water in a stream or river, and where water will flow during flood scenarios.
Dorman shared images of elevation-enabled flood inundation mapping his agency produced prior to Hurricane Matthew, a devastating October 2016 storm that brought 500-year floods to Kinston, N.C., and catastrophic flooding elsewhere in the state.

The image above shows projected flooding (in blue) along the Neuse River in Kinston, based on rainfall forecasts for Hurricane Matthew. The second image below is actual aerial photography of the flooding, which exactly matches the map created in advance of the storm. Note the yellow arrows in both images pointing out buildings that would be spared from the flooding.

Dorman also discussed how flood map data assisted with emergency evacuation efforts in neighboring Wayne County, N.C. Correctional officials were not sure whether they needed to evacuate the jail during Hurricane Matthew, since the building was in an area susceptible to flooding. Dorman’s agency used elevation data to determine that the facility would experience 2 feet of flooding, which it ultimately did at the apex of the storm.
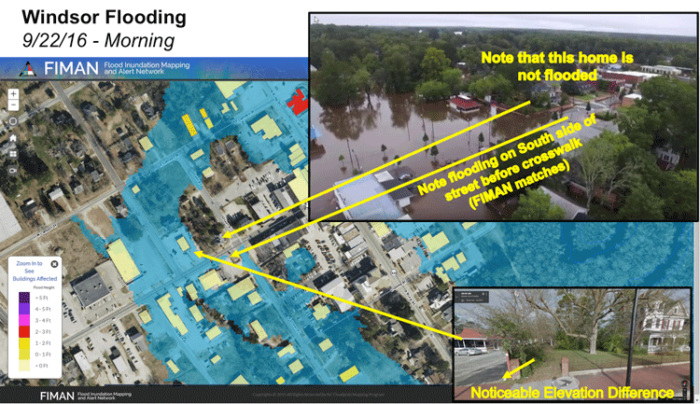
In another example, Dorman cited flooding in Windsor, N.C., just prior to Hurricane Matthew. This image shows projected and actual flooding of the Cashie River caused by Tropical Storm Julia in September 2016. Again, elevation data enabled Dorman’s agency to calculate, building-by-building, which structure would flood, and which would remain on dry land.

Floodplain mapping and flood response isn’t the only application for which the state used this elevation data. North Carolina also relies on the high-resolution LiDAR data for:
- Transportation planning
- Power/utility transmission, distribution and rights of way
- Wildfire management
- Forestry
- Line of site analysis for special events preparation
- School risk management planning and response.
Regardless of which agency uses the elevation data, Dorman noted, it is valuable because it “is resulting in significant cost savings to built environments, and infrastructure identification and management; enabling the state to avoid losses related to hazards, supporting rapid and efficient response to various scenarios, and ultimately helping to protect the lives of North Carolina citizens.”
About the Author
Michael Shillenn has more than 30 years of experience in the design, management and execution of photogrammetric mapping, LiDAR, GIS and data conversion projects for a broad range of customers and end user applications. He is a vice president and senior program manager working for Quantum Spatial Inc., supporting the USGS, as well as other key federal, state and local customers.