
As the world continues to react to the spread of the COVID-19 virus, many nations have lifted restrictions on industry and residents by ending their lockdown phases. As people start to move around more, an increase in pollution has been detected by NASA and European satellites tasked with measuring atmospheric gasses and emissions. (Related: Spatial Analysis of Inflation and the Impact of the Pandemic)
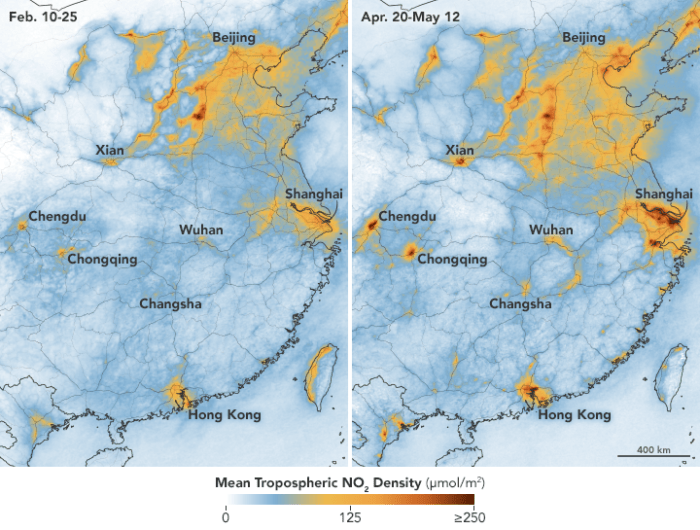
The initial phases of the virus saw a sharp decline in pollution, especially in Chinese industrial centers hit hard by the beginnings of the virus. Lockdowns in China decreased pollution as factories and other industries were shut down and people were confined to their homes. China has begun to reopen its economy, sending nitrogen dioxide levels back to what is considered to be normal at this time of the year.
Reopening Economies During the COVID-19 Pandemic
The increase in nitrogen dioxide is attributed to the use of gasoline, coal, and diesel fuel. As people are able to leave their homes, they are driving to work and starting to travel again. Factories are ramping back up and the number of vehicles on the road and in the air are increasing for the first time in months. The burning of these fossil fuels from this activity causes visible pollution as well as acid rain as it rises through the atmosphere. Pollution contributes to a decrease in global air quality and has been attributed as one of the factors influencing global warming.
ESA and NASA Track Post Lockdown Pollution Levels
The European Space Agency uses its Tropospheric Monitoring Instrument, also known as TROPOMI, to gather atmospheric data from onboard the Copernicus Sentinel-5P satellite. The Aura satellite, owned by NASA, has been monitoring similar data since 2004 using its Ozone Monitoring System (OMI). The combination of newer technology from the European Space Agency and NASA’s longitudinal data can make for interesting and informative data comparisons in regards to global air pollution and greenhouse gas emissions.

These two satellites gathered pollution data during the quarantine in China from February 10th through February 25th. These data were contrasted with the most recent data set that was gathered between April 20th and May 12th when most restrictions were lifted in China. The Aura satellite data from OMI was used to compile information regarding average NO2 emissions from the same time periods since 2004.
Ongoing Atmospheric Changes Post Lockdown
Decreases in nitrogen dioxide have still been observed in countries around China that have maintained their lockdown restrictions, such as India. Past data suggests that pollution levels in China tend to decrease around the celebration of the Lunar New Year, which was celebrated on January 25th this year. Pollution then rises again after the celebratory period, a rise that didn’t occur until weeks later because of the pandemic’s effects. The changes in the seasons as well as weather events can also alter the levels of pollution detected in Earth’s atmosphere.

Reference
Carlowicz, Michael. Nitrogen Dioxide Levels Rebound in China. NASA Earth Observatory. Accessed June 17, 2020. Retrieved from https://earthobservatory.nasa.gov/images/146741/nitrogen-dioxide-levels-rebound-in-china