
Earlier this month, NOAA announced that El Niño conditions had developed in the tropical Pacific. Determining whether El Niño is underway requires monitoring ocean temperatures, winds, atmospheric pressure, rainfall, and cloud patterns across thousands of miles of ocean. No single map, satellite image, or temperature measurement provides the answer.
Much of this information comes from remote sensing systems that continuously monitor the Pacific from space, supplemented by ocean buoys and other in-situ measurements. Together, these observations allow scientists to track changes occurring both at the ocean surface and in the atmosphere above it.
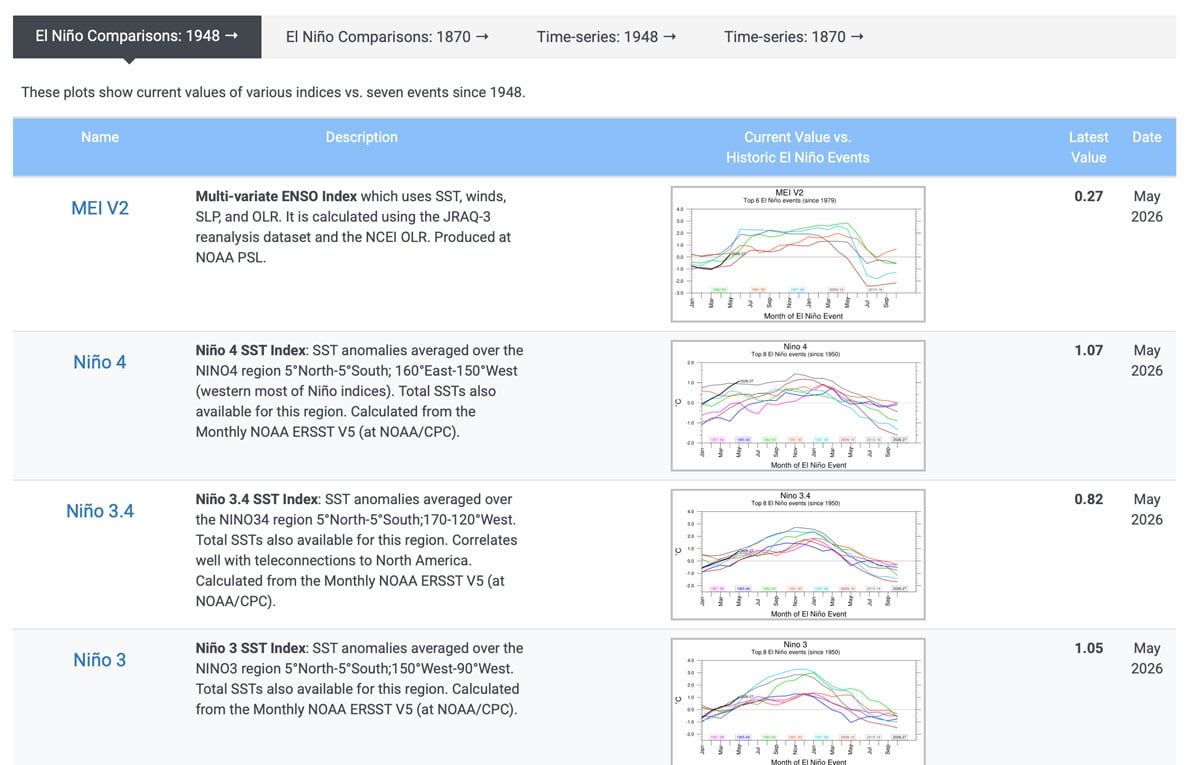
Monitoring El Niño with Temperature Indices
For decades, NOAA relied on the Oceanic Niño Index (ONI) as its primary indicator for identifying El Niño and La Niña conditions. The ONI tracks sea surface temperature anomalies within the Niño 3.4 region of the tropical Pacific, an area centered on the equator that has long been used to monitor ENSO conditions.
In 2026, NOAA’s Climate Prediction Center adopted the Relative Oceanic Niño Index (RONI) for ENSO monitoring and event classification. Unlike the traditional ONI, which compares temperatures in the Niño 3.4 region to a historical average, RONI compares conditions in the region to temperatures across the broader tropical oceans. According to NOAA, this approach helps account for long-term ocean warming while preserving the ability to identify El Niño and La Niña events.
Both indices depend on accurate measurements of sea surface temperature, making satellite observations a critical part of ENSO monitoring.
Sea Surface Temperature
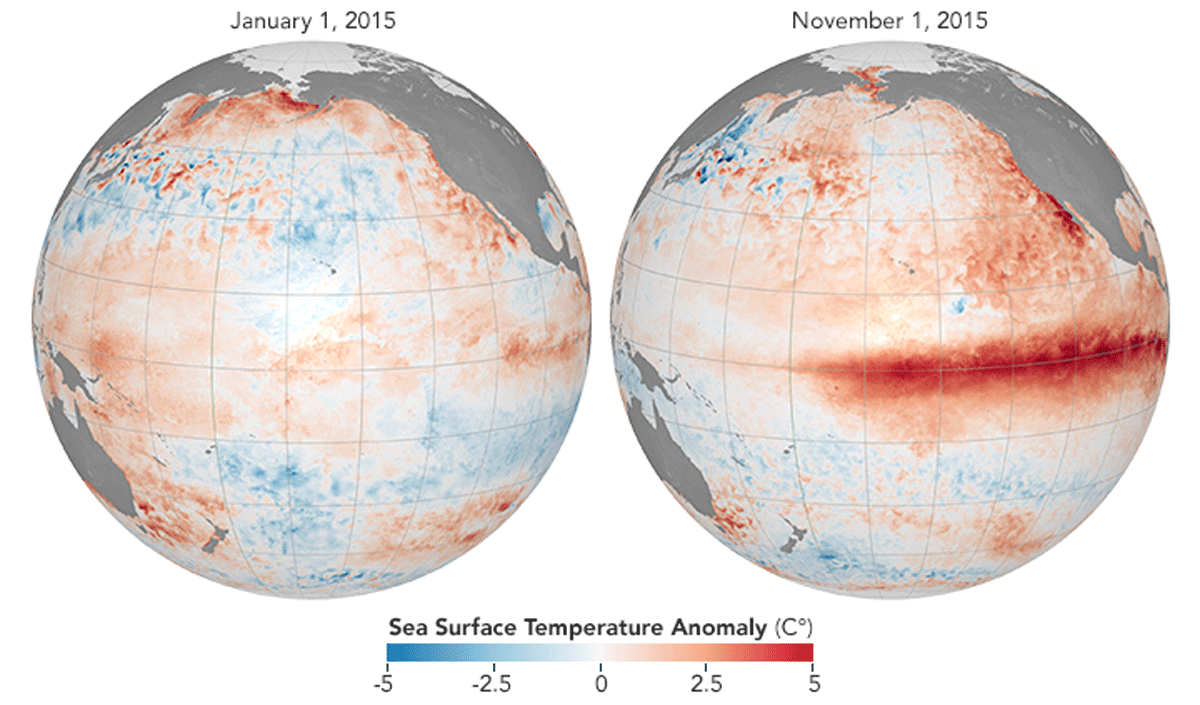
Satellite observations make it possible to monitor ocean temperatures across the entire Pacific basin rather than at a limited number of locations. By repeatedly measuring the temperature of the ocean surface, satellites reveal where warm water is accumulating and how those patterns change over time.
Persistent warming across the central and eastern tropical Pacific remains one of the defining characteristics of El Niño. Whether temperatures are incorporated into ONI, RONI, or other monitoring tools, sea surface temperature measurements provide a foundation for understanding changing conditions across the Pacific.
Subsurface Ocean Heat
Some of the most important changes associated with El Niño occur below the ocean’s surface. Months before the characteristic warming of El Niño appears across the Pacific, large pools of warm water can accumulate at depth. Measuring those temperatures helps scientists estimate how much heat is available to fuel a developing event.
Information about these deeper waters comes from a combination of observing systems, including moored buoys and satellites. Because changes at depth often precede changes at the surface, these measurements can provide an early indication that El Niño conditions are developing.
Sea Surface Height and Ocean Heat Content
Satellite measurements of sea surface height provide another clue about how much heat is stored within the ocean. As water warms, it expands, causing areas containing unusually warm water to occupy slightly more volume than surrounding waters. The result is a subtle rise in sea level that can be measured from space.
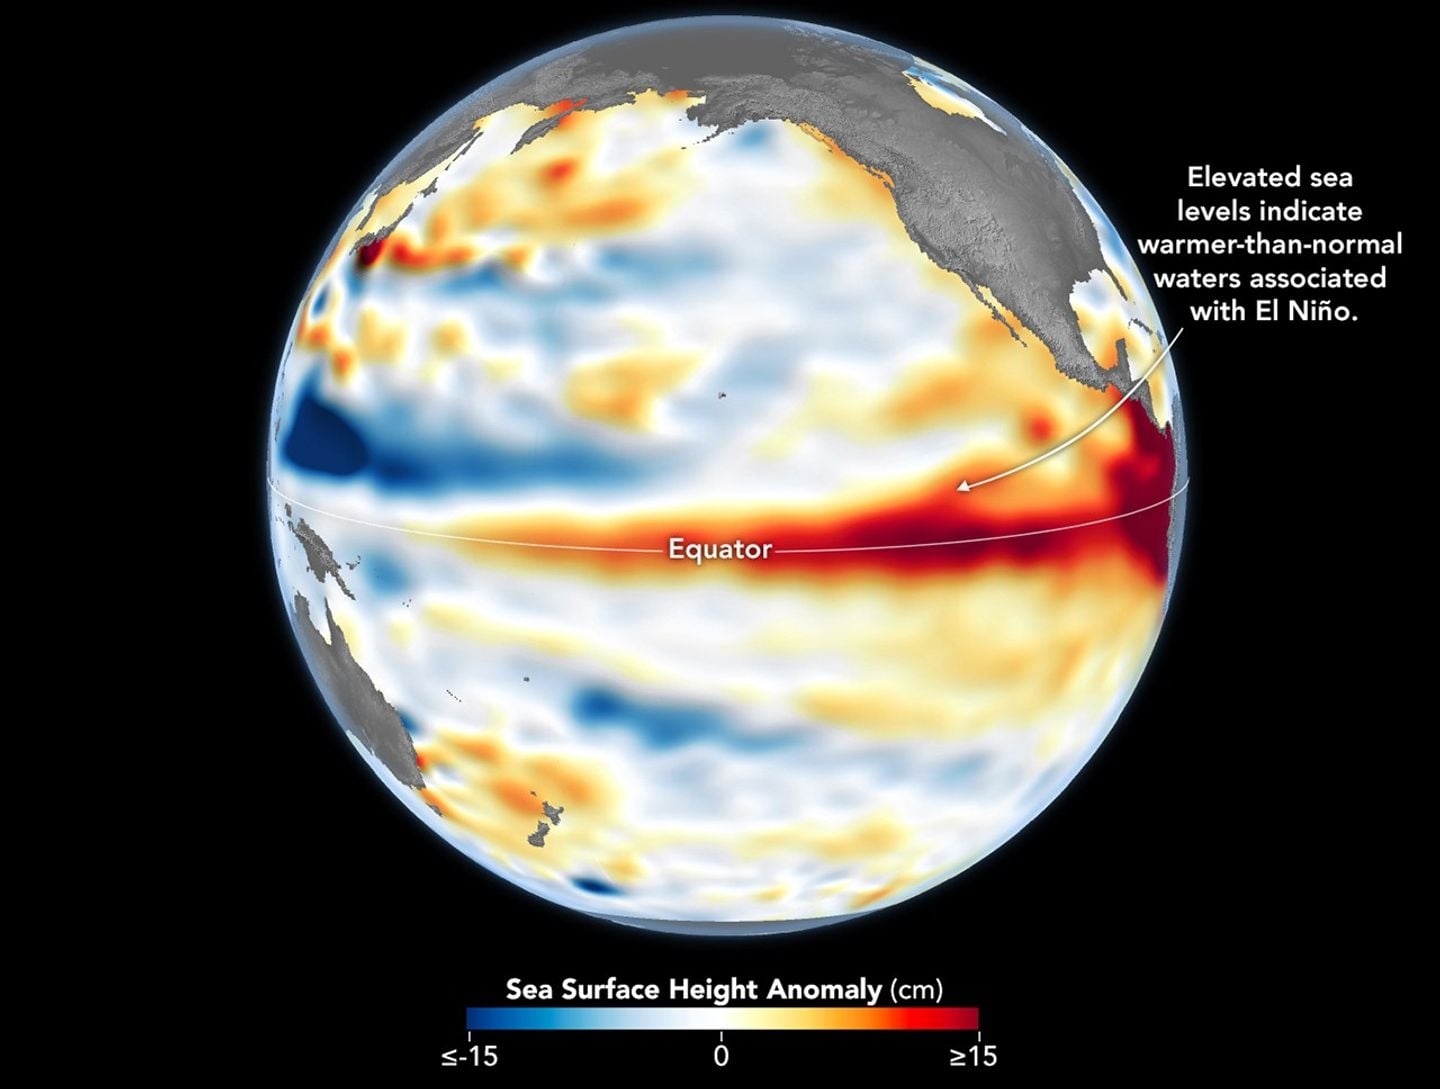
Satellite radar altimeters aboard missions such as Sentinel-6 Michael Freilich can detect these differences with remarkable precision. Recent NASA imagery has shown elevated sea surface heights across portions of the equatorial Pacific, indicating the presence of large pools of warm water stored within the upper ocean.
Most people associate El Niño with warmer ocean temperatures, but the connection between ocean heat and sea level is less obvious. Research has shown that sea surface height can serve as an additional indicator of developing El Niño conditions because ocean warming causes the ocean surface to rise while cooler water contracts.
Tracking Kelvin Waves
Equatorial Kelvin waves are pulses of warm water that move eastward beneath the surface of the Pacific Ocean. As they travel across the basin, they raise sea levels along their path, allowing satellite altimeters to track the movement of warm water from the western Pacific toward the central and eastern Pacific.
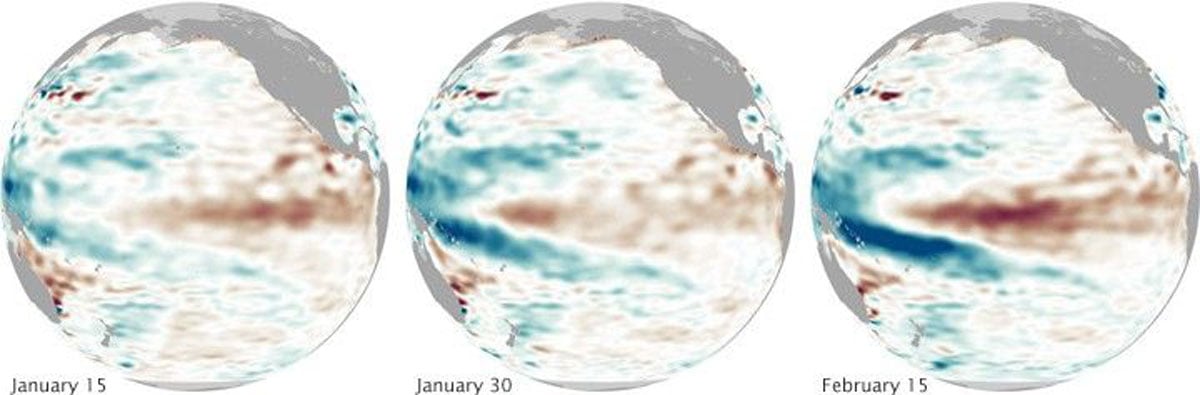
In NOAA and NASA visualizations, Kelvin waves often appear as bands of elevated sea surface height moving eastward across the Pacific. The arrival of these warm-water pulses is often among the earliest signs that El Niño conditions may strengthen.
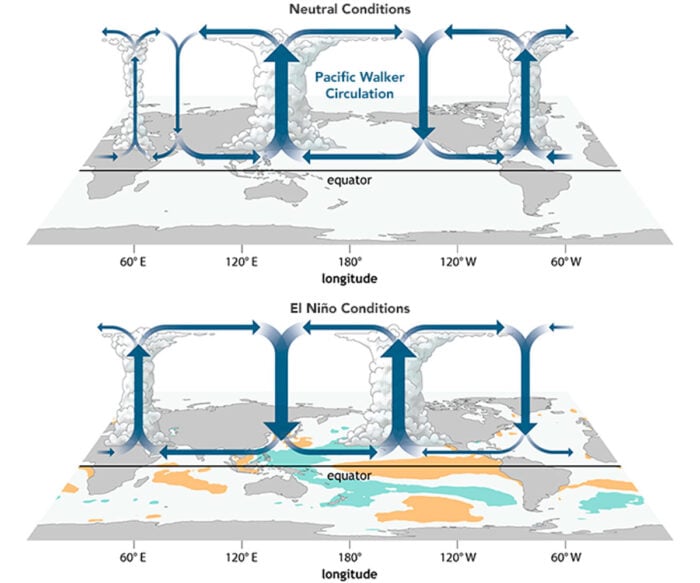
Atmospheric Indicators of El Niño
El Niño is not simply an ocean phenomenon but the result of interactions between the ocean and atmosphere. For that reason, NOAA monitors more than ocean temperatures and sea level, tracking atmospheric pressure patterns, trade winds, rainfall, cloud cover, and atmospheric water vapor across the tropical Pacific.
The Southern Oscillation Index (SOI), which measures differences in atmospheric pressure between Tahiti and Darwin, Australia, is one of the longest-running indicators associated with ENSO conditions. Persistent changes in those pressure patterns are closely associated with the development of El Niño and La Niña events.
Satellites measure outgoing longwave radiation (OLR), the heat energy emitted from Earth back into space. Because thick cloud systems block some of that radiation from escaping, OLR provides an indirect way to monitor cloud cover and atmospheric convection. During El Niño, increased cloud cover and thunderstorm activity often shift eastward into the central Pacific, reducing outgoing longwave radiation and providing another indication that the atmosphere is responding to warming ocean conditions.
Satellites also provide a basin-wide view of atmospheric conditions across remote areas of the Pacific where direct measurements are limited.
Combining Multiple Datasets
No single dataset determines whether El Niño has arrived. Sea surface temperatures reveal whether the Pacific is warming, while subsurface temperatures and sea surface height measurements indicate how much heat is stored within the ocean. Kelvin waves show where that heat is moving, and atmospheric observations reveal whether the atmosphere is responding to those changes.
By combining observations of ocean temperatures, ocean heat content, sea level, winds, rainfall, atmospheric pressure, and outgoing longwave radiation with measurements from ocean buoys and atmospheric monitoring networks, scientists can track the development of El Niño across thousands of miles of the tropical Pacific.
Together, these observations allow scientists to monitor the evolution of El Niño across an ocean basin that covers millions of square miles, turning a complex set of oceanic and atmospheric measurements into a clearer picture of changing conditions in the tropical Pacific.
References
National Aeronautics and Space Administration Earth Observatory. (2023, June 8). El Niño is underway. https://science.nasa.gov/earth/earth-observatory/el-nino-is-underway/
National Aeronautics and Space Administration Jet Propulsion Laboratory. (2023, June 30). NASA-European sea level mission homes in on El Niño. https://www.nasa.gov/missions/jason-cs-sentinel-6/sentinel-6-michael-freilich/nasa-european-sea-level-mission-homes-in-on-el-nino/
National Centers for Environmental Information. (2024, August 6). ENSO detection and monitoring depends on data. National Oceanic and Atmospheric Administration. https://www.ncei.noaa.gov/news/enso-detection-and-monitoring-depends-data
National Oceanic and Atmospheric Administration. (2023, June 8). El Niño forms, expected to strengthen, say NOAA forecasters. https://www.noaa.gov/news-release/el-nino-forms-expected-to-strengthen-say-noaa-forecasters
National Oceanic and Atmospheric Administration Climate Prediction Center. (n.d.). Oceanic Niño Index (ONI). https://www.cpc.ncep.noaa.gov/products/analysis_monitoring/ensostuff/ONI_v5.php
National Oceanic and Atmospheric Administration Climate Prediction Center. (2026, January 9). Announcement regarding the Relative Oceanic Niño Index (RONI). https://www.cpc.ncep.noaa.gov/products/analysis_monitoring/enso/roni/announcement.php
National Oceanic and Atmospheric Administration Physical Sciences Laboratory. (n.d.). ENSO dashboard. https://psl.noaa.gov/enso/dashboard.html
Varotsos, C., Sarlis, N. V., Mazei, Y., Saldaev, D., & Efstathiou, M. (2024). A composite tool for forecasting El Niño: The case of the 2023–2024 event. Forecasting, 6(1), 187–203. https://doi.org/10.3390/forecast6010011