
Subterranean data representation has remained at the corner stone of environmental mapping since the advent of cartography. Spanning back to initial two-dimensional (2D) illustrations, now there are far more options to represent relevant underground data, adding another level of analytical complexity to any information system.
The role of ArcGIS Online in sub-surface mapping
ArcGIS Online serves as one of the primary proprietors of new options for sub-surface mapping, both within their three-dimensional map options. Scenes for instance, allow you to project your data onto a 3D representation of the Earth, allowing for a convex representation of your data in a way more realistic than traditional flat cartography.
Enhanced designability and customization
These features that ArcGIS Online has provided add a greater designability aspect to this area of mapping, giving options for any manner of graphic design within your data representation. Aspects such as point customization and the utilization of density representation. The added ability to convey a three-dimensional map in a format suited to touch screens can make this data portable, and more accessible to both general users as well as to employees who work out in the field.
Interactive map example: oil and gas wells and earthquakes
The sample interactive map below shows two layers: oil and gas wells in southern Kansas and the locations of nearby earthquakes. To see the sub-surface information about the origination of each earthquake, right-click with your mouse and drag it up. This will allow you to tilt the map view.
SceneView: a visually appealing map tool
SceneView proves itself to be one of the more visually appealing aspects of this type of map. The ability to apply programmatic navigation to one’s applications allows for developers to have direct interaction with code that determines specialized features, such as oblique views and z-values.
Being able to adjust a camera on a three-dimensional scale based in data representing both geometries and graphics bring in a greater customization that allows maps to be far more visually distinct.
Applications in Urban Planning and Transport
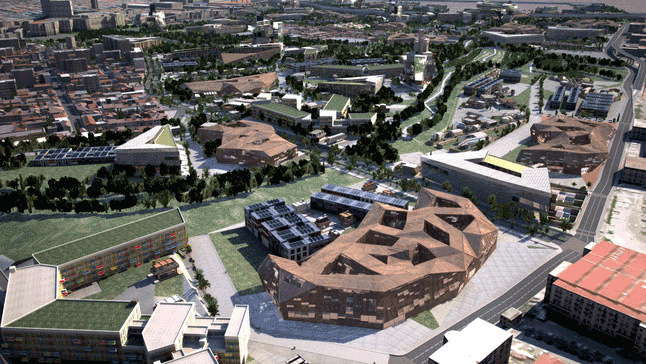
Creating maps with both SceneView and CityEngine brings in more potential, particularly in the realms of transport and urban planning. Government agencies can map out underground transportation in a visually succinct way, with the potential of navigational markers in the form of ground level buildings, to put subterranean networks in greater perspective to users.