
The wettest U.S. hurricane in recorded history occurred when Hurricane Harvey arrived in Texas in August of 2017. Over five feet (1.5 meters) of water was released over southeast Texas by the storm. NASA scientists wanted to learn where water from Hurricane Harvey collected over the region and how long and where that water dissipated. To study this, the researchers used GPS technology to track water volume and movement post-Harvey. The results of these study (along with access to the geospatial data sources) were recently published in the open access journal Science Advances.
Data from over 220 stations equipped with high accuracy GPS units was collected. These GPS units were able to measure changes in the earth’s surface to an accuracy of less than an inch. As water collects on the surface of the earth, the weight of it causes a depression which can be measured with GPS. As the water moves or evaporates, the earth’s then surface rises. By collecting data about changes in vertical motion at these stations, researchers were able to track water movement and water loss through evapotranspiration and runoff over a study area from western Texas to Louisiana. The study concluded that about 30 percent of Harvey’s water was retained on land, mostly as standing water. Standing water caused a lower of the earth’s surface by as much as 20 millimeters (about .78 of an inch) in the land around Houston. The majority of water, about 60 percent, drained over a few days post-storm out to the ocean and Galveston Bay. The remaining 10 percent was released into the atmosphere via evapotranspiration.
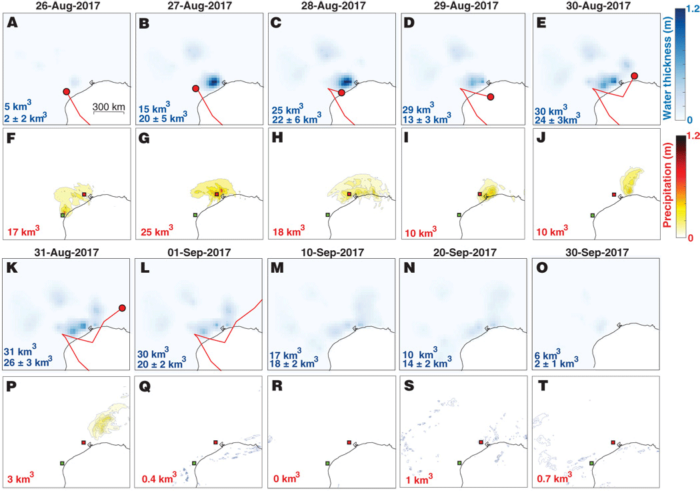
Animation shows changes of GPS vertical positions post-Harvey over time. The warmer colors represent areas where the surface is depressed from the weight of Harvey’s water. The red line is Harvey’s actual path. GPS measured the subsidence, or surface depression, around Houston (center of the image) to be just under an inch (22 mm). The pattern of subsidence also migrated across the Gulf Coast toward western Louisiana over a seven-day period coinciding with the position of the hurricane. Credits: NASA/JPL-Caltech
The study:
Milliner, C., Materna, K., Bürgmann, R., Fu, Y., Moore, A. W., Bekaert, D., … Argus, D. F. (2018). Tracking the weight of Hurricane Harvey’s stormwater using GPS data. Science Advances, 4(9). https://doi.org/10.1126/sciadv.aau2477
More: