
Each year since 1973, scientists have tracked the amount of ice coverage over the five lakes that make up the Great Lakes in the United States.
The Great Lakes region of North America is an freshwater ecosystems on Earth, with the five lakes — Superior, Michigan, Huron, Erie, and Ontario — supporting a vast array of plant and animal life, as well as providing drinking water and other resources to millions of people.
Each winter, the Great Lakes undergo a dramatic transformation as the surface of the water freezes over, forming a thick layer of ice that can cover as much as 90-95% of the surface area in some years. Lake effect snow and the lakes freezing at least partially over are two winter phenomenon for the Great Lakes area.
Why is ice cover on the Great Lakes important?
The extent and thickness of the ice coverage can have a significant impact on the Great Lakes ecosystem, as well as on human activities in the region. For example, the ice can provide a protective layer that helps to insulate the water below from the cold air, which can affect the mixing of nutrients and oxygen in the water, and in turn impact the growth and survival of aquatic plants and animals.
In addition, the ice can affect navigation and shipping on the Great Lakes, as well as recreational activities like ice fishing, skating, and snowmobiling.
Changes in ice cover over the Great Lakes
Over the past several decades, there has been a growing interest in understanding the patterns and trends in Great Lakes ice coverage, and how they may be changing over time. Many studies have focused on the impact of climate change on the region, as rising temperatures and changing weather patterns can affect the formation and duration of the ice coverage.

One recent study, for example, found that ice coverage on the Great Lakes has declined by more than 70% since the early 1970s, and that this decline is likely to continue in the coming decades as temperatures continue to rise. This has important implications for the Great Lakes ecosystem, as well as for the people who depend on the lakes for their livelihoods and recreation.
Great Lake ice coverage in February 2023
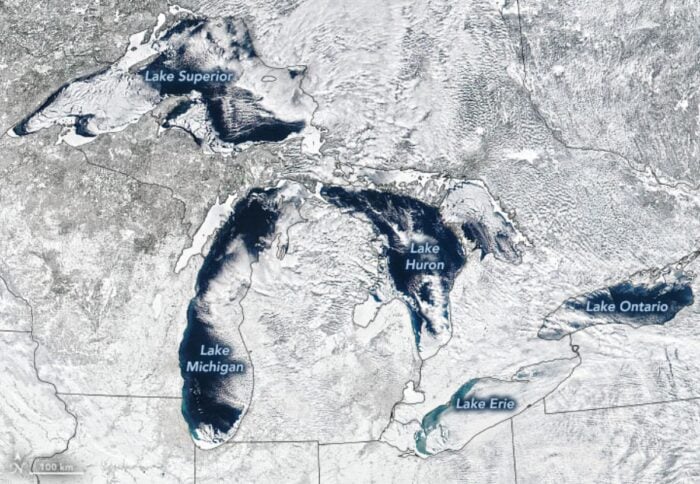
According to the Great Lakes Environmental Research Laboratory (GLERL) of the National Oceanic and Atmospheric Administration (NOAA), the ice coverage of these five freshwater lakes was only 7% as of February 13, 2023, which is well below the expected 35-40% ice cover for this time of the year.
Peak ice coverage for the Great Lakes is usually observed from mid-February to early March.
The low ice cover followed a warmer than normal month of January. January 2023 was the Earth’s seventh-warmest January on record.
This satellite image taken mid-February of 2023 shows how little of the Great Lakes are covered in ice. A small strip of ice can be seen along Lake Huron’s Saginaw Bay. The swirled aqua-blue color of Lake Erie is due to sediment being swirled up from storms.

High ice coverage in 2021 over the Great Lakes
In contrast, the Great Lakes region experienced a significant cold snap and an accompanying polar vortex in February of 2021 that brought unusually low temperatures and heavy snowfall to the area. The polar vortex is a large area of cold air that typically sits over the polar regions during the winter months, but can sometimes be disrupted and move southward, bringing frigid temperatures to areas that are not accustomed to such extreme cold.
The cold snap of February 2021 was particularly notable for its impact on the Great Lakes, as it brought a sudden increase in ice coverage to the lakes that had not been seen in several years. According to the NOAA, the maximum ice coverage on the Great Lakes reached 46.5% in early February of 2021, which was the highest level since 2014.

During the winter of 2013-2014, most of the Great Lakes experienced record-high ice coverage of 88%, due to the early onset and prolonged duration of cold temperatures. Since 1973, the average maximum ice extent on the Great Lakes has been 53 percent, with only five instances of ice coverage exceeding 80 percent since 1973.
Year with the lowest average ice cover for the Great Lakes
Since record keeping began in 1973, the year where the the Great Lakes experienced their lowest average ice extent with only 12 percent of the lakes frozen happened in 2002.

Lake Erie averages the highest ice cover
Lake Erie is the shallowest and southernmost of the Great Lakes. Because the lake is relatively shallow, it can freeze over more quickly and easily than the deeper lakes, such as Lake Superior or Lake Michigan.
Of the five Great Lakes, Lake Erie typically reaches the highest annual maximum ice cover, often exceeding 80 percent. Throughout the past fifty years, Lake Erie has reached a complete ice cover (100% ice coverage) three times – in 1978, 1979, and 1996, and reached 99.8% in 1977.

References
Gillespie, A. (2023, February 17). Low ice on the Great Lakes this winter. Welcome to NOAA Research. https://research.noaa.gov/article/ArtMID/587/ArticleID/2941/Low-ice-on-the-Great-Lakes-this-winter
Hansen, K. (2021, March 4). Wild swings in Great Lakes ice. NASA Earth Observatory. https://earthobservatory.nasa.gov/images/148011/wild-swings-in-great-lakes-ice
Hansen, K., & Carlowicz., M. (2014, February 21). A great freeze over the Great Lakes. NASA Earth Observatory. https://earthobservatory.nasa.gov/images/83169/a-great-freeze-over-the-great-lakes
Historical Ice Cover: NOAA Great Lakes environmental research laboratory. (2023, January 26). Home: NOAA Great Lakes Environmental Research Laboratory – Ann Arbor, MI, USA. https://www.glerl.noaa.gov/data/ice/#historical
Wang, J., Kessler, J., Hang, F., Hu, H., Clites, A., & Chu, P. (2017). Great Lakes ice climatology update of winters 2012-2017: Seasonal cycle, interannual variability, decadal variability, and trend for the period 1973-2017. https://repository.library.noaa.gov/view/noaa/19559