
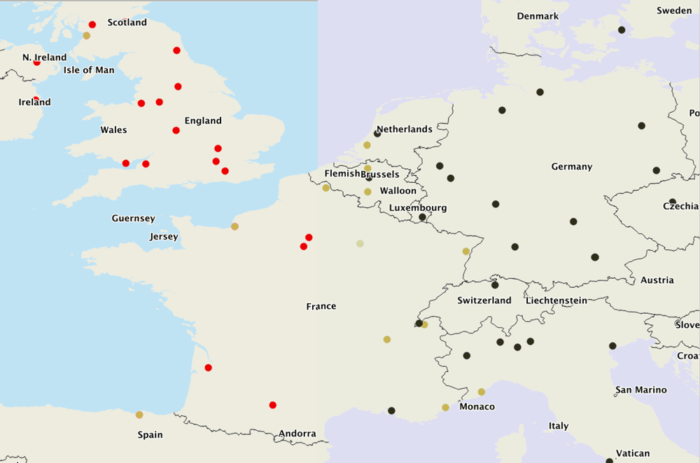
The use of colors in cartography to differentiate groups of spatial features is a common practice. For those with normal vision capabilities, distinguishing between greens and reds is straightforward. Color blindness, of which red–green color blindness is the most common, makes those two shades of color impossible to tell apart.
With the release of QGIS 3, you can now preview how your maps will look for those with two types of red-green color blindness. This latest major release of the free and open source (FOSS) GIS software includes a preview function that let’s you test out how your map color choices will look as a simulated photocopy, fax, and two types of red-green color blindness: protanotype and deuteranope.

To take advantage of this option, first finalize your map. Then, preview the map in different modes by selecting from the menu: View –> Preview Mode. You will notice there are four different simulation modes: photocopy, fax, and two different types of color blindness (protanotype and deuteranope). These two types of color blindness are known as “red–green color blindness” which means that they are unable to distinguish red and green hues. Select the preview mode you want to simulate and the map pane will instantly change the color modes.

Video Tutorial: How to Use QGIS to Preview Your Map in Color Blind Mode

See Also
- Making Color Blind Friendly Maps
- Viz Palette Helps You Pick Colors for Data Visualizations
- Analyzing Eye Movement For Better Map Design