
We usually associate satellite imagery as something that can measure or observe our visible environment or surroundings we build for ourselves. However, more than just this, satellite imagery could potentially give us insight into behaviour or even outcomes that affect our health. This is the case with obesity, where the built environment could be an important indicator of how obese people are likely to be in a given area. Furthermore, other proxies, including unnatural light at night could also be affecting the global rise in obesity.
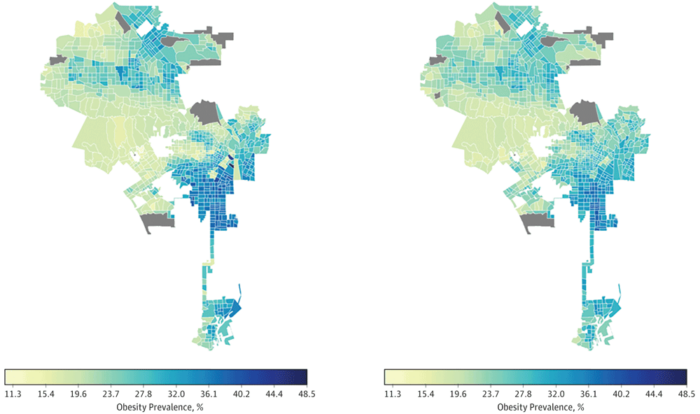
Obesity is not evenly distributed in places. Often, high obesity rates are associated with levels of income disparity, access to certain types of foods, or even climate. However, the design of cities plays an important role. Simple features, such as sidewalks or parks, have been seen to be less apparent in neighbourhoods where obesity is high. One study recently looked at about 150,000 high resolution satellite images of cities in the United States along with census data of these areas. Applying a convolutional neural networks (CNN) artificial intelligence algorithm helped to show that the built environment did show 64.8% of obesity prevalence across all census areas. In other words, in many cases it is evident obesity has some relationship with the built environment that can be observed and classified using CNN.[1]
Such results do not mean that the built environment alone is responsible, as other underlying causes, such as those places also having high rate of poverty, could be affecting the underlying results. The authors realize that machine learning and satellite imagery alone cannot determine relevant key causal factors, but satellite data can demonstrate utility in finding traits healthcare workers can now look out for. They also help provide a readily accessible proxy that could be used to understand where obesity is likely to be. In other words, one could also potentially forecast obesity in a given area given past patterns.[2]

Furthermore, the study by Maharana and Nsoesie is not the first to try to link satellite imagery and obesity, although it does take a new approach. Another study, for instance, indicated that obesity could be linked to unnatural light, suggesting that satellite imagery that view nighttime lighting could also be used to measure expected rates of obesity. In this case, unnatural light could affect sleeping cycles, which then affects metabolism.[3] In fact, it is not just the United States or countries often associated with relatively unhealthy foods but rather obesity is becoming a global phenomenon, as it is now found in nearly everypart of the planet. This fact has led researchers to suggest artificial light could be a far more important factor than thought, as the body’s normal night rhythms are affected. Data looking at unnatural light showed that 70% of the obesity rate variation could be explained by this, although other factors are also acknowledged by the study (e.g., lifestyle, food, etc.). [4]
What the studies may show is that obesity maybe affected by several relatively modern and global developments. First, increased urbanism, with more built up areas that have less accessibility to the outdoors, are potentially affecting or limiting physical activity. Second, artificial light might also be affecting the natural body cycles which affect metabolism and ability for the body to process food. The body may simply function differently under conditions that are artifical. The results by Maharana and Nsoesie certainly accommodate multiple possibilities and the reality is that various contributing factors are likely. Furthermore, the build environment also likely reflects other factors, such as poor nutrition choices, available to some people in areas that have few parks or outdoor areas. In other words, the built environment could also be reflecting other factors that lead to greater rates of obesity. Nevertheless, what the studies show is that machine learning and satellite imagery have the potential to also inform us about factors that have traditionally been measured using surveys or other instruments.
References
[1] For more on how CNN is used with imagery and demonstrating obesity in the built environment, see: Maharana, A., & Nsoesie, E. O. (2018). Use of Deep Learning to Examine the Association of the Built Environment With Prevalence of Neighborhood Adult Obesity. JAMA Network Open, 1(4), e181535. https://doi.org/10.1001/jamanetworkopen.2018.1535.
[2] For more on the authors’ insights into the study, see: https://www.smithsonianmag.com/innovation/what-can-satellite-imagery-tell-us-about-obesity-in-cities-180970354/.
[3] For more on unnatural light and obesity, see: Ghosh, T., Anderson, S., Elvidge, C., & Sutton, P. (2013). Using Nighttime Satellite Imagery as a Proxy Measure of Human Well-Being. Sustainability,5(12), 4988–5019. https://doi.org/10.3390/su5124988.
[4] For more on the global effect of obesity and use of imagery, see: Rybnikova, N. A., Haim, A., & Portnov, B. A. (2016). Does artificial light-at-night exposure contribute to the worldwide obesity pandemic? International Journal of Obesity, 40(5), 815–823. https://doi.org/10.1038/ijo.2015.255.