
GIS Software
Information about GIS software and applications including both commercial and open source GIS applications. This category covers desktop GIS (Esri’s ArcGIS suite, MapInfo, QGIS, and GRASS) as well as web mapping, GIS apps, mobile GIS, and component GIS.

WMS Map Viewer
WMS Map Viewer, developed by Pantelis Rodis, is a http/JavaScript application for visualizing, combining and indexing web maps.

GIS and Flight Training
The future of aviation technology looks to continue to utilize GIS in ways that allow better training and smarter aircraft.

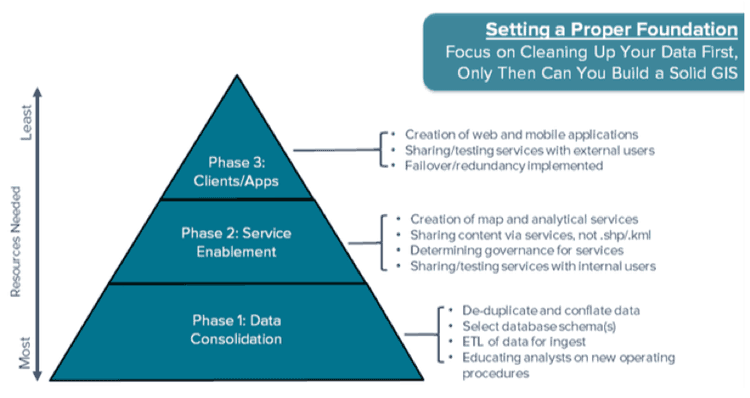
Streamline GIS Project Workflow with Online Recordkeeping
For efficient collaboration on a GIS project, document and catalog all work in an easily accessible location to overcome common challenges with diverse skill sets.
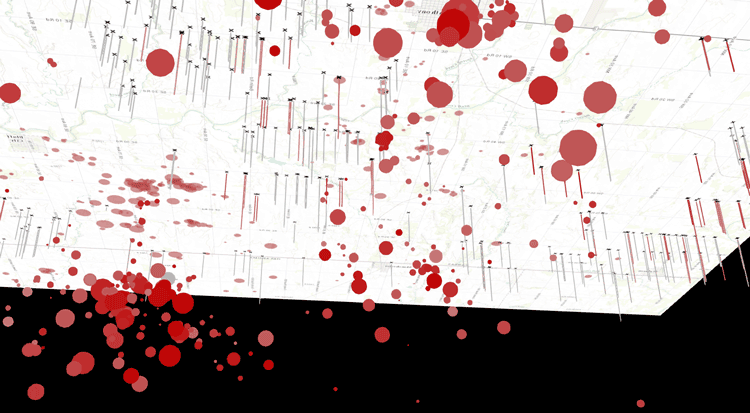
Sub-surface Mapping and Subterranean Data Representation
ArcGIS Online advances sub-surface mapping with 3D options, enhancing design, accessibility, and customization for urban planning and transportation.

Creating and Editing Features with MapInfo
This tutorial by Nick Williams, a MapInfo trainer at Acuity Training, provides an overview of how to create, edit, and convert features within MapInfo.

GIS RoadMap and Mobile Strategy for Engaging Missouri Constituents
Douglas Fees, the Information Technology Services Chief with the Missouri Department of Conservation (MDC) discusses how his agency collaborated with Timmons Group to develop a GIS roadmap and mobile strategy that resulted in a suite of applications to better serve citizens, visitors and internal MDC staff.

Understanding What Six GIS/Map Software Providers Offer
Matt Sheehan from WebMapSolutions is posing a series of six questions to six GIS/map software companies (Pitney Bowes, Esri, Mapbox, Carto, GIS Cloud, and Boundless) to understand their similarities and differences in product offerings.

Create Custom Map Projections
Flex Projector is a free and open source, platform agnostic software application that lets users upload GIS data and create customized small scale global map projections.

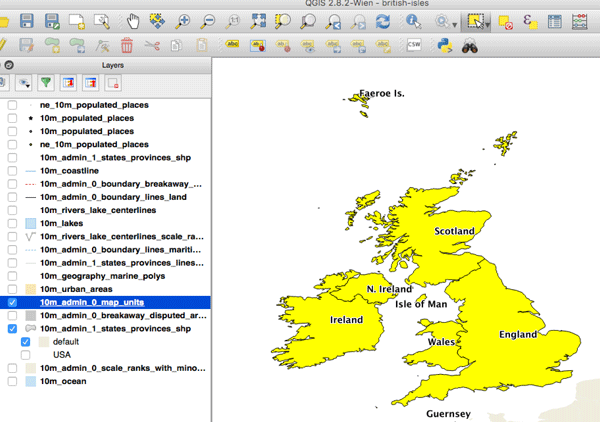
How to Create a Non-contiguous Cartogram Using QGIS
This article presents a rough idea of how one might mimic a non-contiguous cartogram using QGIS.

Finding Love Using GIS
The omnipresence of location, GIS functionality in mapping, and measuring potential dates near you, has had a substantial social change in the dating world.

MapInfo Resources
Here are some suggestions for peer support and resources offered for users of MapInfo.

VANE Query Language: Intuitive Access to Satellite Imagery
Georgy Potapov of OpenWeatherMap introduces the release of the VANE language service, an entirely online service that presents a new concept for accessing satellite imagery. Potapov shares OpenWeatherMap’s vision of how developers can work with satellite and weather data to help the overall geoinformation market to grow.

Using R with GIS Software
With the utility of R, many popular statistical procedures and more advanced analyses, including a variety of simulation applications, can be applied directly within GIS tools such as QGIS.
Harness the Power of Open Source GIS with a Hybrid Architecture
Anthony Calamito, Chief Evangelist at open source GIS company, Boundless, explores how companies can harness the power of their open source GIS systems.
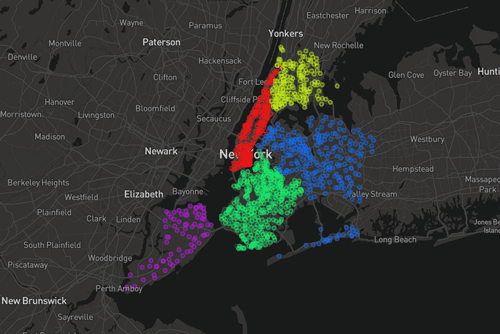
How To Make a Map From Open Data Using a Spreadsheet
Jonathan Goldman explains in this tutorial how to extract an open data feed from a civic data portal and pull it into Google Sheets, and then map it quickly using Geosheets.

GIS and Visualizing Atmospheric Science Data
The use of new data models has allowed more traditional GIS data models to be integrated with those used in atmospheric science.

Using the TravelTime Search API to Generate an Isochrone
This step-by-step guide developed by staff at TravelTime shows how to draw a travel time polygon, filter points of interest by travel time and deliver A to B routing information all in one API call.
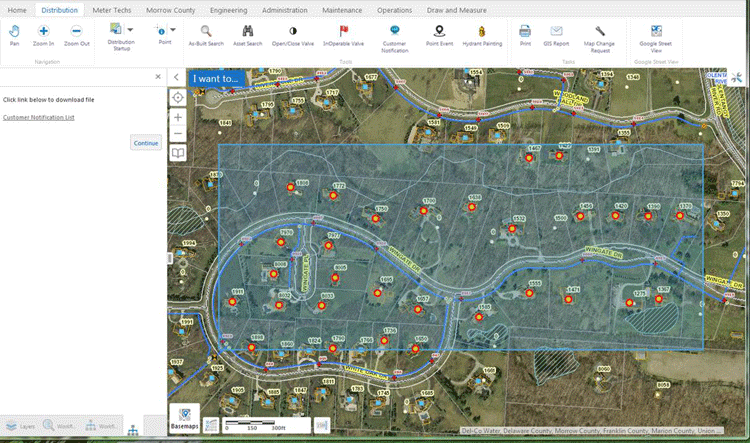
Using GIS to Streamline and Automate Asset Management
Michael Boyd from Novotx writes about how Del-Co Water Company in Ohio uses GIS to to automate workflow processes and streamline operations.

How to Make the Most of QGIS
To get the most out of QGIS it’s not enough to simply know how to write the lines of code you need, and how to integrate with other exciting tools but rather, the more control you have over a tool like QGIS, the more you’ll be able to visualize and explore your ideas.
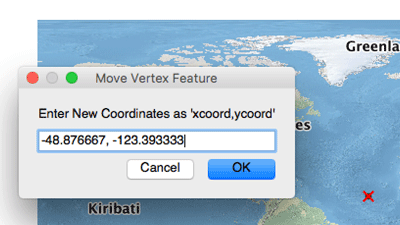
How to Map a Single Set of Coordinates Using QGIS
Here are the steps you need to follow if you want to map a single set of coordinates with QGIS.
How to Convert a Selection into a New GIS Dataset Using QGIS
Here is a step-by-step tutorial on how to convert a geographic selection from one GIS dataset into a new GIS file using QGIS.

GIS and CAD Integration
Mark Altaweel discusses efforts to create a truly integrated system, where CAD components and software concepts work with GIS data.

Personalized GIS
In personalized GIS, software is being developed to anticipate our needs and provide recommendations based on our behavior, past preferences, and the preferences of others.

Terrapattern: Search Engine for Satellite Imagery
Terrapattern lets users perform "similar-image" searches in unlabeled satellite imagery using deep learning machine vision techniques.

Multi-view GIS
Multi-view GIS provides different perspectives of space and time for a given geographic area.

Agent-Based Modeling and GIS
The need to understand emergent phenomenon in a variety of fields has led to not only greater use of agent-based models (ABMs), but we are increasingly seeing tools that integrate GIS with ABMs.