
Eudel Cepero shares his experience developing a popular story map for Diario de Cuba using ArcGIS Online.
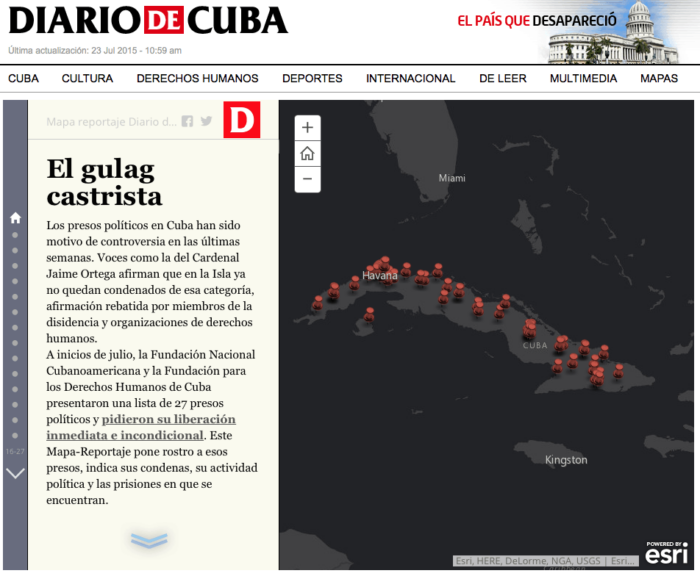
A Story Map allows us to write from “where,” that is, from the location where the news is taking place – on an interactive digital map. It answers the five W’s in journalism, namely: “who,” “what,” “when,” “why,” and “how,” and also use images, videos, and sound to support the narration – which is why Story Maps are a powerful tool for digital journalism.
With these ideas in mind, I contacted Pablo Díaz, director of Diario de Cuba (DDC). I suggested using Story Maps in his digital newspaper to highlight the originality of the paper’s content, thus making it more attractive to readers, which would eventually increase the number of visitors to the site. After several emails, calls, and a conversation in Madrid, Pablo accepted.
What is Diario de Cuba?
Diario de Cuba (DDC) is a non-governmental, Madrid-based, Spanish digital newspaper. It was founded in 2009 by Pablo Díaz and a group of Cuban journalists interested in creating an independent space dedicated to sensitive and current Cuban reality issues. The editorial line of Diario de Cuba is separate from the Cuban dictatorship that controls the island’s media and does not allow independent press.
ArcGIS for Server vs. ArcGIS Online
Using Story Maps in an online newspaper is not free. Someone who knows how to make Story Maps is needed, a GIS Analyst, and a server to publish are required. Using ArcGIS for server was an option, this would allow application customization to imitate the newspaper design, but this implied a higher cost. ArcGIS Online (AGOL) was the second option. There were fewer customization capabilities but had the same variety of Story Map templates at a lower price and without having to maintain server infrastructure. Finally, I obtained a three-year finance deal for a subscription to AGOL and the funds for a part-time GIS Analyst at 10 hours/week. In October 2014 the funds were released, my small consulting company, Geoidea, was hired for GIS analysis and the work began.
Initiation
During the first three months, we worked on creating the DDC account in AGOL and basic homepage tasks (the gallery, groups and user roles). At the same time, we began to make a series of test Story Maps with journalists. These exchanges were critical because they allowed reporters to understand the format and functionality of the Story Maps, and how they can add value to their work. In a short time, the DDC reporters not only saw the benefits of the Story Maps but also began to propose exciting new ways to use them. Initially, we thought about training writers in creating their Story Maps, but the learning curve was rather large and demonstrated that it is better to work as a team. The GIS Analyst was in charge of managing the AGOL portal and creating the layers, maps and story maps, and the journalists provided the content.
Execution
We worked on a “Story Map ideas list” at the same time—incorporated Story Maps that reflected news issues of the time, for example, a Story Map planned was “Interventions of Castroism,” and a Story map to cover an emerging story was “Fidel Castro’s Funeral.” A successful idea proposed by a reporter was follow-up Story Maps which, indeed, served as the continuation of the news that was in progress at the time. We maintained this structure with “Dry feet, wet feet: illegal emigration 2016,” for more than two years—one of the most popular DDC Story Maps of all time.
Another effective idea was the use of Story Maps to make news summaries, for example, “2016: A year of arrests, harassment, and confiscation of journalists,” dedicated to locating and narrating freedom violations of expression on the island. This type of map was also used for numerous “before” and “after” topics such as “Baracoa before and after,” which showed the devastation of Hurricane Irma in Cuba.
Design
Regarding design, we worked to adapt the Maps to the newspaper’s style as much as possible. We used the same or similar colors and fonts for headings, texts, footnotes, etc. We started using AGOL Assistant to translate the Map template headings and legends into Spanish. The Story Maps were embedded inside the DDC website via iframe. They were located by order of importance first as the top story as headline news, then lowered to secondary stories and later to a gallery created within the newspaper (not the app). There was also a link to the DDC Portal in AGOL.

Facts and Features
There were 336 Feature Layers, 388 Web Maps and 83 Story Maps produced during the three-year contract with DDC; of which, about 77 Story Maps made the newspaper. The Story Map “Dry feet, wet feet: illegal emigration in 2016,” is the most seen with 1,697,056 views. Other Story Maps published with great acceptance were “Cuban Migration Crisis 2017,” with 1,215,881 views, “The media power of Castroism,” with 406,421 views and “Regular flights between the US and Cuba,” with 312,877 views. The most used Story Map templates were Story Map Journal, Cascade, Tabbed, Bullet, Side Accordion and Shortlist.

Money
Diario de Cuba (DDC) could not secure the necessary funds beyond three years. In December of 2017, the ArcGIS Online subscription expired, and the maps and Story Maps were left in the DDC AGOL Portal. The lesson learned is that any digital publishing company that decides to invest in GIS technology needs financing in the long-term.
It is important to note that when ArcGIS Online (AGOL) suspends a subscription, all hosted features such as maps and apps stay in the cloud but cannot be seen or shared. Perhaps Esri could revise the terms so that a suspended account allow existing content visibility and shareability by its subscribers. For example, in DDC’s case, all content on Cuba is unique and public, but as of right now, it cannot be shared.
Story Map Reporter
Although the Story Map Journal and Cascade are suitable templates for news articles, none are genuinely responsive to most online newspaper structures. Generally, the window of an article in a digital publication is rectangular or squared and contains rectangular or squared sections for content. One of those circumscribed rectangles is used for the title followed by another that may be used for an image, static maps or video and the body text section usually comes last. ArcGIS can create the “Story Map Reporter,” a versatile template for digital publications. It should contain the article window and internal sections mentioned above and have the text, images, maps, videos, and graphics interact with responsive maps and vice versa.
Bright Future
The improvement of Story Map templates and other GIS options together with the increase of journalism and public relations graduates that take GIS-related classes indicate that Story Maps will become an increasingly important tool in digital journalism. For now, the Diario de Cuba Story Map journalism experience marks a path to georeferencing journalism.
About the Author
Eudel Cepero is a GIS Senior Analyst for Miami-Dade County, GIS Professor at The University of Miami and GIS Entrepreneur at Geoidea Inc.