
crowdsourced GIS

5 Ways GIS Users Can Broaden Their Geospatial Skills
From programming and remote sensing to volunteering and networking, there are many ways to build new geospatial skills.

Crowdsourcing Archaeological Data with Participatory GIS
People with little or no training in archaeology or geographic computing systems can build GIS data using Humap's Placemaker.

The “Bystander Effect” With Crowdsourcing GIS Data
A recent research article found that users are less inclined to contribute to crowdsourced geospatial sites like OpenStreetMap and Waze if they know others are already contributing.

Mapping the Progression of Invasive Species with Crowdsourced Data
Researchers have mapped out approximate 48,510 harlequin ladybird (Harmonia axyridis) sightings – all obtained through participation of the public – over the course of a decade.

GIS and Social Activism
Groups promoting various causes are implementing geospatial approaches and GIS related technologies.

The Future of Street Level Photos in Mapping
Using mobile phones, 360-degree cameras, car dashboards and helmet cameras, Mapillary’s users take geo-tagged pictures of the roads they travel which the app automatically uploads to Mapillary’s platform. Then, Mapillary stitches the photos together and turns them into an immersive, navigable, street level view of the world.

Black Holes No More: The Emergence of Volunteer Geographic Information
This essay by Ron Mahabir takes a look at how crowdsourced mapping efforts are helping to fill in much needed geographic information about impoverished areas around the world.

Using Citizens to Map Atmospheric Particulates
By leveraging data from over 8,000 smartphone users, Dutch researchers successfully mapped atmospheric particulate levels.

Mapping the Outbreaks of Diseases
In August of 2014, the World Health Organization declared a public emergency in response to the growing number of Ebola ...
Typhoon Haiyan (Yolanda): The Mapping Response from the Tech Community
Typhoon Haiyan (locally referred to as ‘Yolanda’[1]) made landfall in the Philippines on Friday November 8th 2013. Officially, 1839 people ...
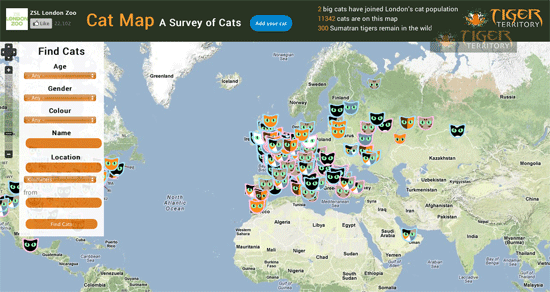
Cat Map
With over 11,000 cat locations mapped to date, the Cat Map is a crowd sourced survey of domestic feline