
Maps and Cartography
Maps and cartography are essential tools in geography that enable us to visualize and understand the Earth’s surface and its features.
Cartography is the art and science of creating maps, which involves the use of sophisticated technology and techniques to accurately represent the Earth’s physical and cultural features.
Maps provide a visual representation of the world, allowing us to identify patterns, explore spatial relationships, and navigate through unfamiliar terrain.

Why Do We Blindly Follow Our GPS?
Stories abound of people blindly following GPS directions, leading to the term "death by GPS". Why do people put so much faith in digital directions?

Map of Where the Population of Europe Is Growing and Where It’s Declining
An interactive map of Europe has been compiled with census data showing areas of the continent where the population is growing and declining.


EJSCREEN: Mapping the Connection Between the Environment and Demographics
EJSCREEN is a mapping app that intersects data sets from recent censuses and environmental maps to help users understand the relationship between the environment and demographics.

Geography of Fortune 1000 Companies in 2015
This article takes a look at the basic geographical distribution of Fortune 1000 companies in 2015 by state, city, and ZIP code.

Fortune 1000 Companies List for 2015
Below is an excerpt from the list of Fortune 1000 companies for 2015 and is shown to demonstrate the locations ...

When You Can’t Make Make Mental Maps: Developmental Topographical Disorientation
Developmental Topographical Disorientation is a rare neurological condition that prevents people from creating mental maps of their surroundings and impairs navigation.

Tile Grid Maps
One issue with choropleth maps is that geographic areas that are small in area can oftentimes become indecipherable when viewed on ...

Conjunction Junction Found in the Brain: Helps with Spatial Navigation
Researchers at the University of California, San Diego have identified the area of the brain, the retrosplenial cortex, that helps put together the necessary spatial information for navigation.

A Modern Statistical Atlas of the United States with an 1870s Twist
Modern data maps of the United States based on government data, produced to look like maps created in the 1870s.

Philanthropic Mapping
Learn about how philanthropic mapping is helping to develop geographic data for needed areas around the world.

Map of Global Lightning Strikes
NASA has created a world map showing the intensity of lightning strikes from 1998-2013.

Tracking Public Perception about Climate Change
The Yale Climate Opinion Maps track public opinion among adults on attitudes about climate change.
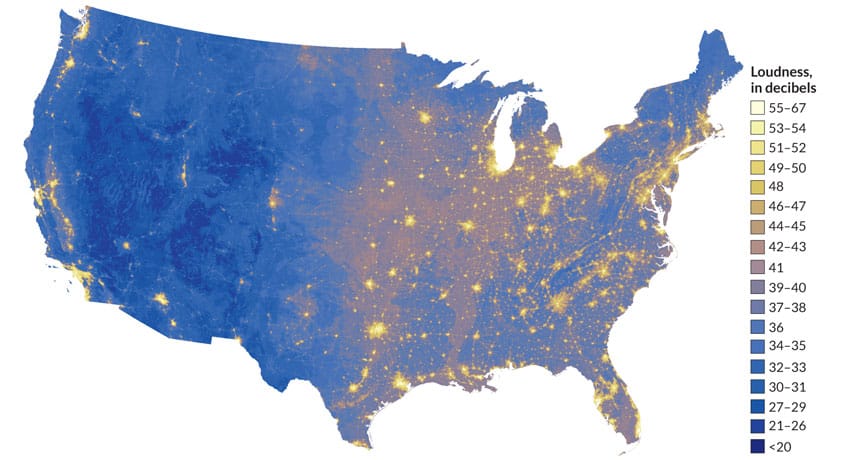
The Sound of Silence: A Noise Map of the U.S.
A map from the NPS displays the noisiest as well as the quietest places in the United States.

Geography of the International Date Line
The International Date Line is an imaginary line of longitude that divides two days and is placed at 180 degrees east or west of the Greenwich Meridian.
Paper Maps Refuse to Die in the Digital Age
In today’s era of digital maps, the use of paper maps might seem a bit antiquated. When Google Maps are ...

Photographing and Mapping Piers
Ana Ramirez, a San Diego-based photographer, talks with Kristina Jacob about her photography project, Into The Ocean – Photos of California Piers.

Using Interdisciplinary World Map Activities to Connect Your Students to Other Cultures
Here are some interdisciplinary activity ideas to help children learn math, history, science, and literature while also strengthening map skills.

How Mental Map Development Affects How We Perceive the Visual World Around Us
A new study is challenging the way scientists look at the brain’s visual and spatial orientation system.

Peace Corps World Map Project: Bringing Geography Education to Unexpected Places
In 1988, a Dominican Republic Peace Corps Volunteer established the World Map Project to deliver fundamental geography education to schools and communities in the world's most remote locations.

Mapping Digital Attacks Around the World
The site Digital Attack Maps shows the leading Distributed Denial of Service (DDoS) attacks happening at the moment.

Mastering Geography
Here are some people who have amazing memories when it comes to geography.

Continents and Population Density
The worksheet below is aimed towards helping elementary school students uses graphs to learn about the different continents and the ...

The Oldest Known Map of the World
The oldest known world map is the Babylonian Map of the World known as the Imago Mundi.

Mapping Almost 250 Years of Buildings in Manhattan
Morphocode‘s Urban Layers allows users to drill down and view the history of Manhattan’s buildings by mapping out over 45,000 ...

StateFace
Here’s a font collection cartographers and those in GIS might want to download for future use. StateFace is a sets ...