
Maps and Cartography
Maps and cartography are essential tools in geography that enable us to visualize and understand the Earth’s surface and its features.
Cartography is the art and science of creating maps, which involves the use of sophisticated technology and techniques to accurately represent the Earth’s physical and cultural features.
Maps provide a visual representation of the world, allowing us to identify patterns, explore spatial relationships, and navigate through unfamiliar terrain.

Types of Medieval European Maps
From the earliest civilizations onwards people have been drawing the world around them on stones, clay tablets, papyrus, and more. ...

The Geographer by Johannes Vermeer: Geography in Fine Art
The Geographer was painted by Dutch artist Johannes Vermeer in 1669.

Photozincography: Advances in Cartography
Photozincography, or heliozincography, was a revolutionary way of copying photographic negatives onto zinc to be used for map making, outlines, engravings, and the reproduction of images.

Camels Now Part of Google’s Street View Imagery Program
Google uses many different ways to capture its growing street level imagery, including using trikes, snowmobiles, and trolleys. Most recently, ...

Was an Inaccurate Map Partly Responsible for Napoleon’s Waterloo Defeat?
A French documentary filmmaker argues that a cartographic mistake played a significant role in Napoleon's army succumbing to defeat by the Duke of Wellington's forces in the Battle of Waterloo.

An Ocean of Mountains
With the help of satellite technology, a team of American and European researchers recently announced that they have discovered thousands of new mountains on the ocean floor.

Work on “Inner GPS” in the Brain Wins Nobel Prize in Medicine
Over the course of three decades, two separate research efforts helped unwrap the questions of “how does the brain create ...

The Map Myth of Sandy Island
Sandy Island near Australia has long appeared on maps even though it doesn't exist.
Mind Over Map: How Our Concepts of Reality Affect Map Making and Vice Versa
The nature of maps as portrayals of the world mean that they can both represent physical reality but also create it at the same time.

Map Orientation
Maps have not always been orientated northward. Different regional and religious forces have influenced the orientation of maps over time.

What are Mental Maps?
Mental maps are a personalized view of the world's geography. Mental maps combine a person's objective knowledge of places with their subjective perceptions, or opinions, of locations.

How to Make a Map from a Shapefile Using Google Fusion Tables
This tutorial shows you how to make a map in Google Fusion Tables with shapefile data.

How to Make a Map with Excel Data Using Google Fusion Tables
This article will take you though a step-by-step example of using an Excel spreadsheet that contains location information to make a map using Google Fusions Table.

What is Exo-cartography? Mapping the Climate and Surface of Exoplanets
Exo-cartography or extrasolar cartography is the science of mapping planets that are outside of Earth’s solar system.

Eight Online Maps in Celebration of the 50th Anniversary of the Wilderness Act
In celebration of the 50th anniversary of the Wilderness Act, Wilderness50 was launched by a coalition of agencies, organizations, and universities to help elevate wilderness protection.

Mapping the Impacts of Climate Change in California
A group of Stanford students taking a biology class entitled Geographic Impacts of Climate Change: Mapping the Stories have mapped out news and journal articles about climate change in California.

Travel through Time with New York City’s Maps
The New York City Public Library introduces an online map warping tool, offering access to over 10,000 historical maps of the city.

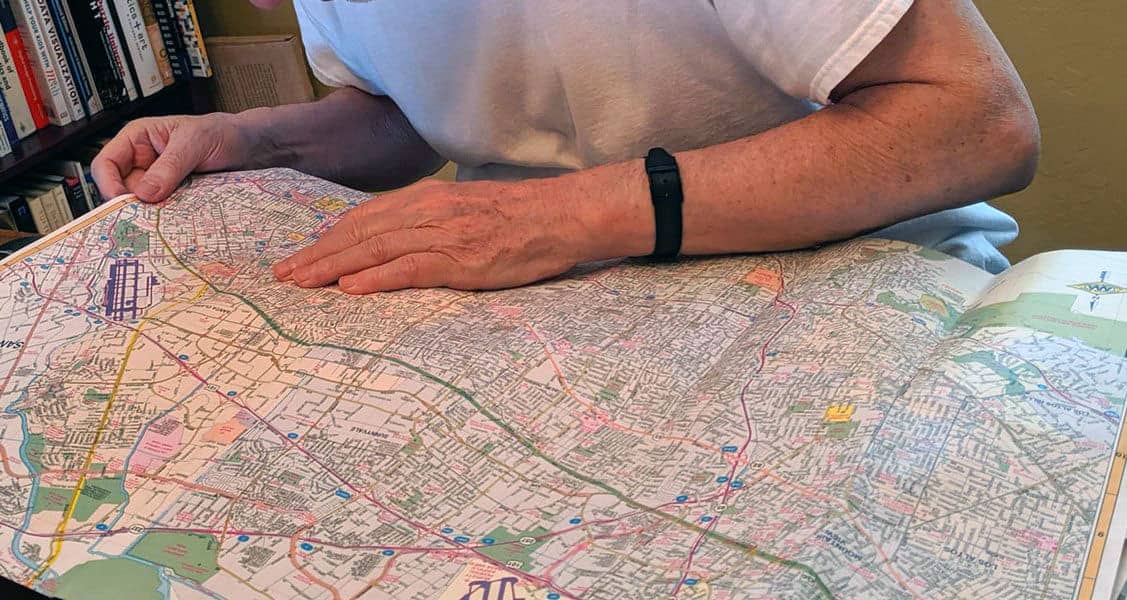
What is a Map?
A map is something we’ve all likely held in our hands, scratched our heads over or marked with pushpins to ...

Maps of Israel
Printable maps of Israel. This collection of maps showing the country of Israel include a detailed map showing major cities ...

Help Find Invasive Weeds in Hawaii
Tomnod, which previously helped with crowdsourcing the search for the missing Malaysian Airlines flight, has teamed up with the Nature Conservancy ...

Map Traps: Intentional Mapping Errors to Combat Plagiarism
Mapmakers have been known to create trap streets, which are fictional streets inserted on a map with the intention of fighting plagiarism.

Explore Maps of the United States from 1884 to 2006
The U.S. Geological Survey and Esri are working together to make over 178,000 maps of the United States available to the public via an ...

What is a Pole of Inaccessibility?
A pole of inaccessibility is a geographical point that represents the most remote place to reach in a given area, often based on distance from the nearest coastline.

Mapping Time: A Detailed Look at Minard’s Flow Map
Mapping Time: Illustrated by Minard’s Map of Napoleon’s Russian Campaign of 1812 combines historical and geographic analysis with cartography to examine mapping change over time.
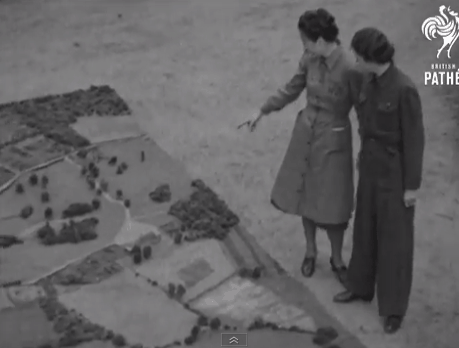
Sunday Maptinee: Map Films from British Pathé
British Pathé has released a trove of map and cartography related movies dating back to the 1930s.

Maps Show How Tech Bus Stops Are Affecting San Francisco Evictions
The Anti-Eviction Mapping Project has plotted out the incidences of “no-fault” evictions in San Francisco against shuttle stops for technical workers. Many ...