
Maps and Cartography
Maps and cartography are essential tools in geography that enable us to visualize and understand the Earth’s surface and its features.
Cartography is the art and science of creating maps, which involves the use of sophisticated technology and techniques to accurately represent the Earth’s physical and cultural features.
Maps provide a visual representation of the world, allowing us to identify patterns, explore spatial relationships, and navigate through unfamiliar terrain.
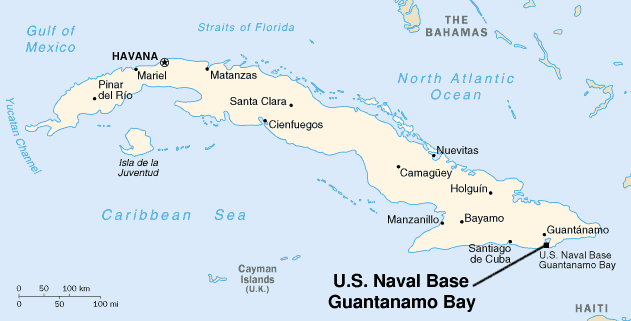
Call for a Guantanamo Bay Marine Research Facility and Peace Park
As Cuba hopes to be seen as environmentally aware and take action in conservation and many in the United States want to distance themselves from the reports of torture and international law violations in Guantanamo, the article in Science calls for the base to transition into a marine research facility.

Explore the Literary Geography of London
Authorial London is a project that geolocates geographic references about London from writers that have lived in the United Kingdom's most populous city.

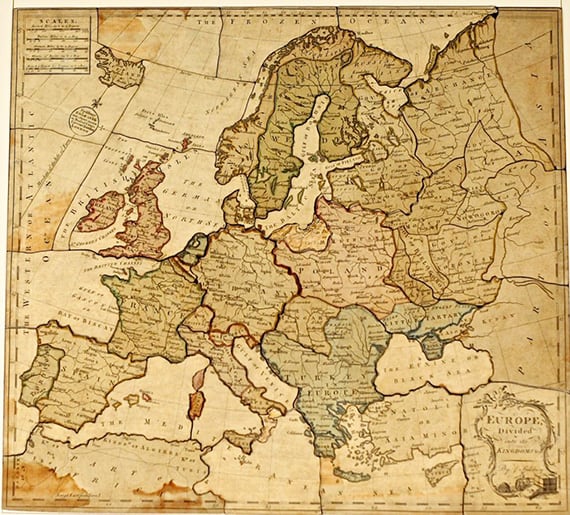
World’s Oldest Surviving Terrestrial Globe
The world’s oldest terrestrial globe exists in Germany and shows the world as it was known in 1492 when it was created by Martin Behaim.

Where Can You See From the Sea?
Cartographer Andy Woodruff maps out what is directly across the ocean depending on where a person is standing along each continent's coastline.

Color Maps to Your Heart’s Content With this City Maps Coloring Book
City Maps: A coloring book for adults is a 94-page book containing 44 maps covering cities from around the world.

How Users are Helping to Map Kenyan Slums
One of the latest ongoing, user-generated mapping projects involves the mapping of slums in Kenya.

The Map that Started the Red and Blue Election Map Trend
Historian Susan Schulten has traced the practice of mapping elections of the country by color to 1883.

Eartha: The World’s Largest Revolving Globe
Eartha, housed in the lobby of DeLorme's headquarters is the World's Largest Revolving Globe.

Geographic Profiling of Banksy
Scientists at Queen Mary University of London have used spatial profiling techniques in an attempt to discover the real identity of enigmatic graffiti artist Banksy.

Atlas of Urban Geography from the 16th Century Reissued
The earliest atlas of cities, Civitates Orbis Terrarium (or Cities of the World) captured a time of incredible urban development and cartographic innovation.

Map Any Word Across the World
Word Map is a fascinating online mapping application that lets the user type in any word and see that word mapped in the official or dominant language of each country around the world.

One of the Oldest Terrestrial Globes to Go 3D
A globe housed by the New York Public Library globe from around the year 1510 one of the oldest terrestrial globes ever created recently underwent 3D imaging.

Earthquake Time Bombs
In his new book, Earthquake Time Bombs, Yeats discusses the world’s most dangerous earthquake hotspots, the communities at risk, and how the public can mitigate the effects of future disasters.

Cartography in Literature Now Online
The History of Cartography project has scanned and made available online its series "Literary Selections on Cartography."

Cartography and the American Revolution
A new book discusses the history and importance of mapmaking in the United States. The Revolutionary War prompted some major leaps in charting the newly formed United States of America.

Mapping the Destruction of UNESCO World Heritage Sites
Culture Under Threat Map was launched to highlight the destruction happening to historical sites in the Middle East and North Africa.

The Sound of Satellites
NASA collaborated with architects Jason Klimoski and Lesley Chang to create a way to hear the sounds of different satellites orbiting above the Earth.
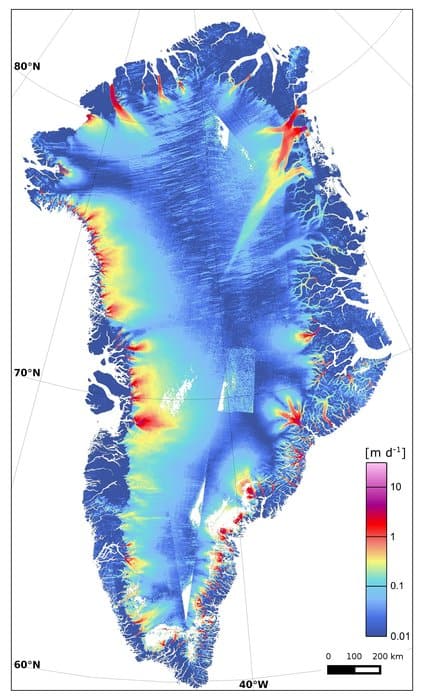
Ice Loss in Greenland
Recent research has shown that one of Greeland’s largest glaciers is losing up to five billion tons of ice every year as it melts into the ocean.

Roads to Rome Mapping Project
Three researchers had the idea to answer their own version of the old question, “Do all roads still lead to Rome?” by mapping out the routes around the world to places named Rome.

Terra Pericolosa and Terra Incognita
Terra pericolosa and terra incognita were terms used by Ancient Roman and Medieval cartographers to indicate either dangerous or uncharted areas on maps.

Map of the Earth’s Antineutrino Glow
A new map of antineutrino emissions has been created by scientists using data collected by detectors in Italy and Japan.
Dissected Maps: the First Jigsaw Puzzles
The earliest jigsaw puzzles were created as educational tools. Known as "dissected maps" these early puzzles were used to teach geography.

Data Visualization Strategies Using Tile Grid Maps
A new mapping method has emerged with high-profile news outlets like The New York Times and Bloomberg Business which are using tile grid maps, which represent each state with a congruent square

Recent Efforts to Map and Cleanup the Ocean Garbage Patches
The Ocean Cleanup has recently sent out a ship full of researchers and volunteers to help map and begin cleanup efforts on the Pacific Ocean garbage patch.
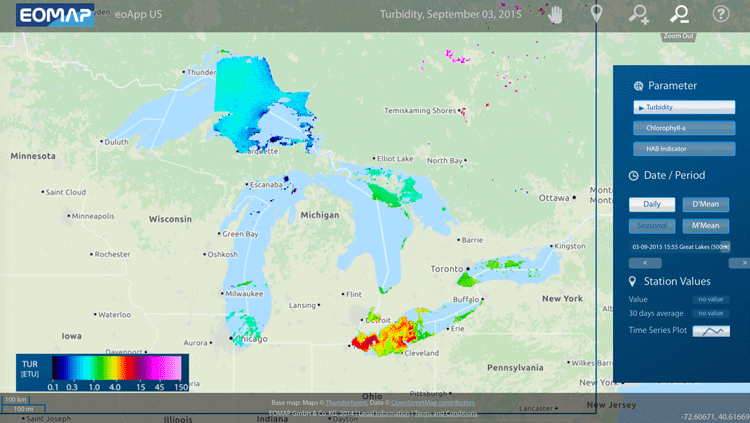
Mapping Algal Blooms in Lake Erie
EOMAP has released a mapping application designed to track algae blooms in Lake Erie.

The Prime Meridian isn’t Where You Think it is
The true Prime Meridian is located about 334 feet east of the current Airy Transit Circle at the Royal Observatory in Greenwich, England.