
Mark Altaweel

Mapping Caves
Mapping caves has proved difficult, especially vast, complicated caves that can span for kilometers underground.

How Reintroducing Wolves Changed Yellowstone National Park
Scientists have documented the trophic cascade effect of reintroducing wolves to Yellowstone National Park.

Advancements in Mapping Jellyfish: Integrating Remote Sensing and Geospatial Technologies
Mapping swarms of jellyfish has significantly improved due to a combination of remote sensing data, UAV and satellite data, and algorithms that estimate jellyfish migration based on current data.

Mapping Small Bird Migrations
Our understanding of bird migrations is changing as a result of tracking devices on birds, especially for small bird species.

Remote Sensing for Carbon Offsetting
Remote sensing and geospatial technologies are being harnessed for carbon offsetting efforts.

Lost Underground Rivers
Cities like London and New York City have a long history of paving over rivers.

Mapping Heat Vulnerability from Satellite Data
Satellites are being used to measure heat not only on urban heat islands, but also on farms and other locations where rising temperatures are having an impact.

Mapping the Earth’s Freshwater Bodies
Over 95% of the world's lakes, rivers, and freshwater reservoirs will be measured by a new satellite mission called Surface Water and Ocean Topography (SWOT).

Using Open Source Geospatial Data in Journalism
Geospatial data such as satellite imagery can be used by journalists to verify news stories.

The Global Evaporation of Lakes
Researchers used satellite imagery and modeling to calculate the evaporation volume across over 1.42 million natural and artificial lakes.

Mapping Oil Slicks With Satellite Imagery
Sentinel-1 synthetic aperture radar (SAR) satellite data has been used in a study to map oil slicks.

Can GIS Help Ease Supply Chain Problems and Inflation?
GIS and spatial technologies could help to lessen the impact of supply chains, which are causing some of the high inflation prices.

Aerial Snow Mapping
Researchers are increasingly use UAS/UAV platforms for measuring snow cover data, particularly snow depth.

Reliability of Machine Learning Maps
Academics are increasingly adopting machine learning maps to better understand what can happen for a range of environmental events.

Measuring Nitrogen Dioxide Levels in Urban Zones using Geospatial Methods
Earth observation and geospatial techniques have improved the ability to measure nitrogen dioxide at ground level.

Big Data and Animal Migration
Scientists are using big data methods combined with modern GPS tracking and machine learning to enhance their understanding of global animal migration patterns.

Higher Resolution U.S. Flood Maps
Researchers have developed a high resolution flood map for the United States.

Turning Geospatial Skills Into a Business
Those with GIS and geospatial skills have a variety of options for launching their own businesses.

Extracting Geospatial Data from Historical Maps
Geospatial methods can detect location names from historical maps, make them searchable, and allow for the automated extraction of geographic data from those maps.

Kriging in Geography
Spatial kriging is a commonly used interpolation technique for estimating raster values.

GOES-T: Next Generation Weather and Space Monitoring
The launch of the GOES-T (GOES-18) satellite provides coverage for the United States' West Coast, Hawaii, and Alaska.

Landsat 9 Data Released
Landsat 9 satellite imagery and data has been made publicly available.

Detecting Methane With Satellites
Satellite technology plays an important role in pinpointing sources of methane emissions, a vital step in mitigating this greenhouse gas.

Remote Sensing of Lightning
Satellites and remote sensing tools are providing a way to better forecast and determine the severity of lightning.

Understanding How Carbon Storage Can Help Meet Climate Goals
The storage of carbon is a critical part of rebalancing the carbon cycle to ensure that climate change is less severe than many predict.
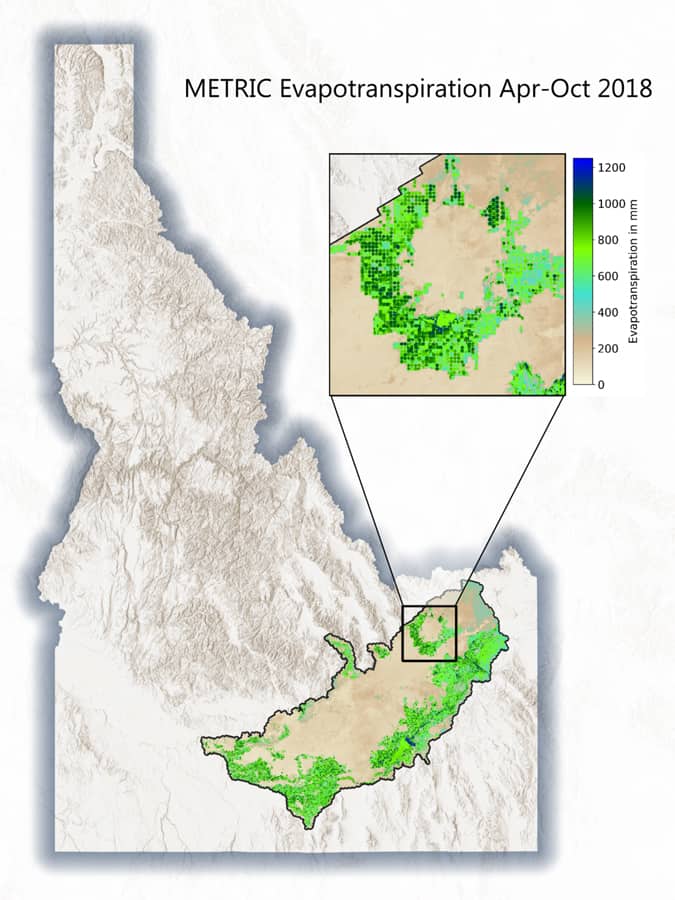
Geospatial Tools for Agricultural Water Management
The use of geospatial technologies can help mitigate inefficient use of water and help improve how this precious resource is used in crop production.