
Mark Altaweel

Mapping Heat in U.S. Cities
NOAA has been coordinating an effort to map urban heat islands in cities across the United States.

Warmer Ocean Temperatures are Bleaching Coral Reefs
Higher ocean temperatures, along with overfishing and pollution, are leading to more coral bleaching events.

Highly Detailed Seafloor Maps
Researchers from MBARI have developed methods to map the ocean floor at incredibly high resolution.

Potential Collapse of the Atlantic Meridional Overturning Circulation
A new study predicts that the Atlantic meridional overturning circulation (AMOC) could potentially collapse within this century.

Mapping Building Heat Using Remote Sensing
Startup Satellite Vu launched the first of a satellite constellation to measure building heat signatures in high resolution.

When Did the Anthropocene Begin?
The Anthropocene is a proposed geological epoch defined by the significant influence of human activity on Earth's ecosystems and geology.

Groundwater Pumping Is Shifting Earth’s Axis
Researchers have found that the enormous amount of groundwater being pumped is changing the Earth’s tilt and increasing sea level rise.

How Remote Sensing and GIS Are Improving Wildfire Forecasting
Advances in GIS, satellite imagery, and AI are helping scientists forecast where wildfires are most likely to ignite, spread, and produce hazardous smoke.

Cities are Changing Cloud Formations
Researchers looked at cloud patterns over urban areas for 447 cities in the United States using satellite imagery.

Mapping Tornado Tracks with Satellite Data
Researchers used satellite imagery and remote sensing to map tornado tracks.
Using Open GIS Data to Map Public Urban Green Spaces
Learn how OpenStreetMap and Sentinel-2 satellite imagery are combined to accurately identify public urban green spaces for GIS analysis and planning.

Mapping Snowpack and Forecasting River Rise in California
Measuring snow and forecasting snowmelt effects on river rise is important for planning for California's water needs and to mitigate flooding.

Wildlife Conservation in the Face of Climate Change: The Importance of Protected Areas
Protected areas are important for providing refuge to amphibians and reptiles impacted by climate change.

Mapping Social Vulnerability to Natural Hazards
Geospatial technology can be used to map social vulnerability to natural hazards, aiding in disaster planning and response.

Solutions for Greening Cities
There are various solutions for implementing green infrastructure in cities including the removal of on-street parking to create space for tree planting.

Changes to the Global Water Cycle
Researchers are using Earth observation satellites to track changes to the global water cycle.

New Techniques for Measuring Biodiversity With Remote Sensing
New satellite imagery techniques make it easier to observe plant biodiversity and map changes over time, allowing conservationists to plan for the future.
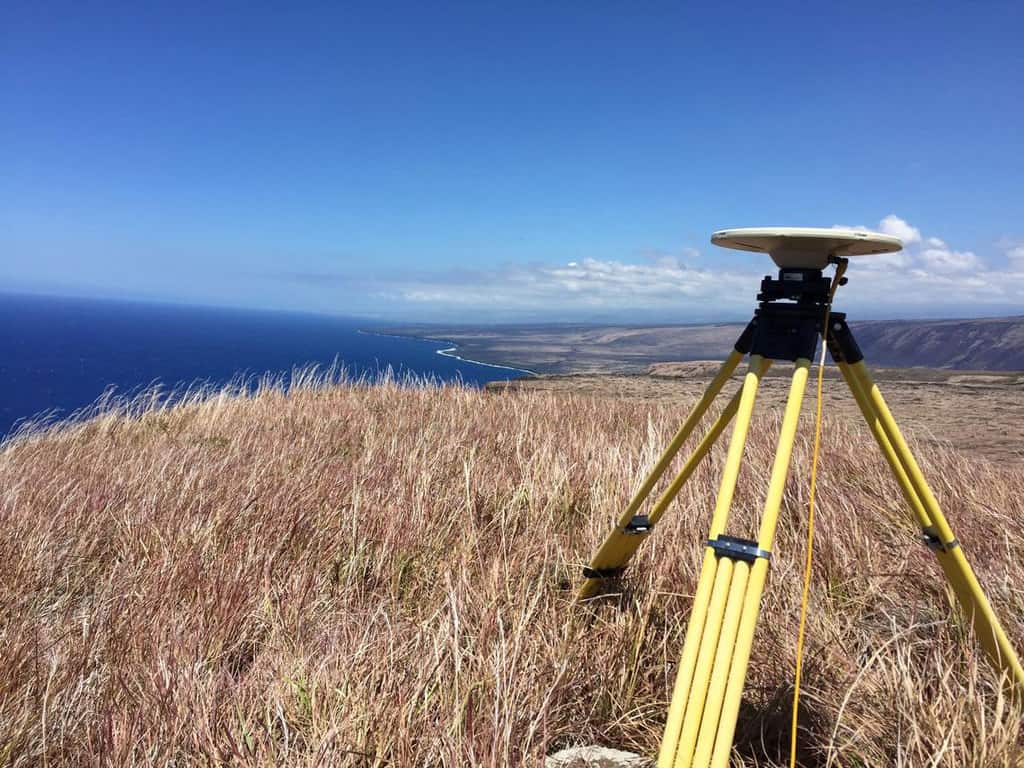
Improving the Accuracy of GPS and GNSS
To improve accuracy and signaling of GPS and GNSS, a new technique that depends on ground-based systems has been developed.

Mapping Coastal Ecosystem Change
A collaboration initiative, called coastTrain, helps to provide data so that scientists can better address challenges coastal regions face.

Using Ancient DNA to Reconstruct Past Ecosystems
Two-million-year-old DNA from Greenland's permafrost reveals a rich ancient ecosystem, including mastodons, showing past climate impacts and adaptation.

Heatwaves are Affecting Rivers in the United States
Heatwaves are having an impact on rivers in the United States.

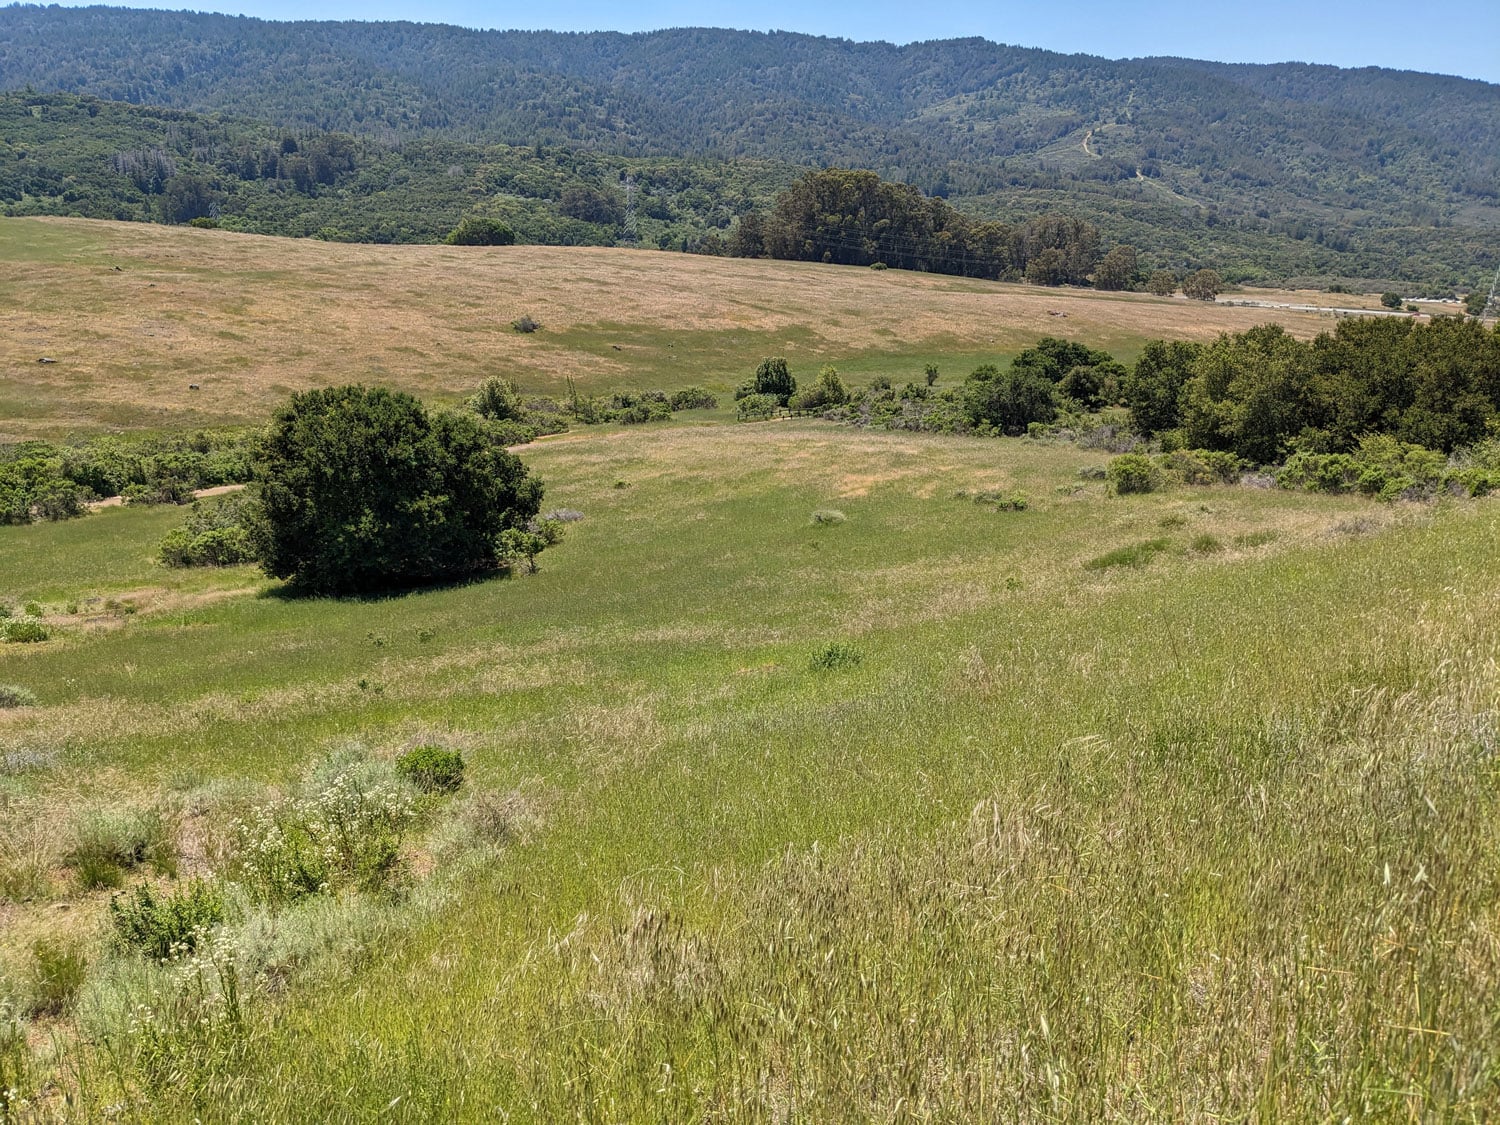
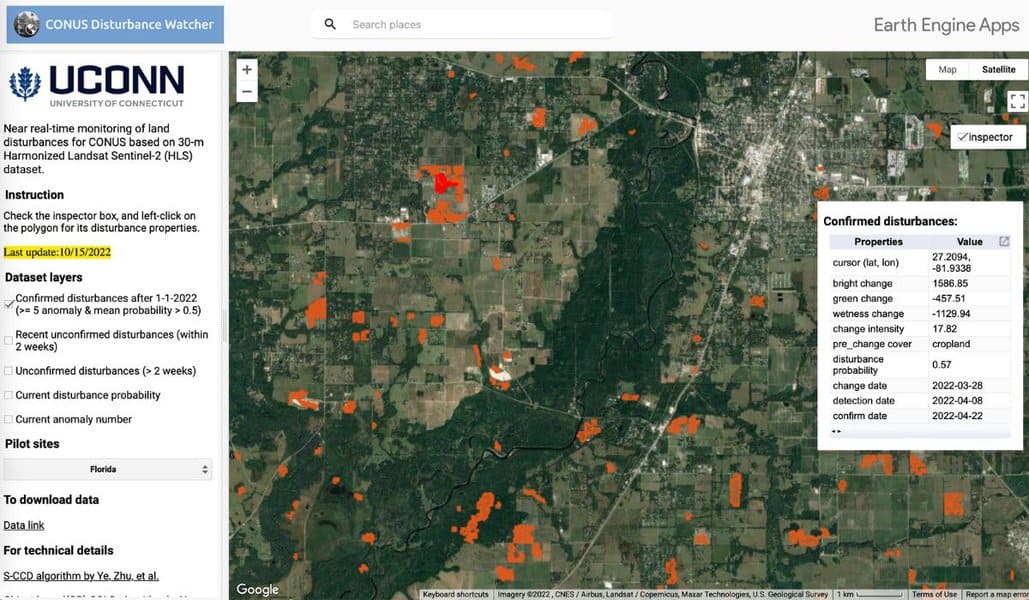
Mapping Long-term Land Use Change with Remote Sensing Data
Discover how remote sensing technology is used to map land use changes, providing valuable insights into environmental impacts and aiding conservation efforts.
Using Geospatial Technologies to Map Hurricane Response
Using satellite data and artificial intelligence, researchers have developed a way to rapidly map hurricane destruction.

Mapping Bee Populations: Understanding Distribution and Conservation
Scientists use spatial science to monitor bee populations and address declines caused by insecticides, habitat loss, and climate change.

GIS and Spatial Interpolation Methods
The use of spatial interpolation methods in GIS have proven vital from areas such as public health to interpreting weather patterns.

Mapping Forest Resources
Machine learning, satellite imagery, and data on forest ecology can be brought together to create better information for resource managers by mapping forest resources.