
Mark Altaweel
GIS and Modern Research from Historical Maps
While GIS offers a way to digitize detailed historical records and maps, it can also provide a new way to understand history and trends over time.

GIS, Elections, and Politics
Political geography focuses on past election cycles in order to look at how voting patterns develop and why. Mark Altaweel discusses how GIS can be used to study those patterns.

GIS and Quick Response Codes
As smart phones and Quick Response Codes (QR codes) have become ubiquitous, it perhaps should not be surprising we are beginning to see applications integrating QR code data with GIS.

Using GIS to Map Drug Trafficking
GIS has significantly aided police in crime prevention, notably in fighting drug trafficking.
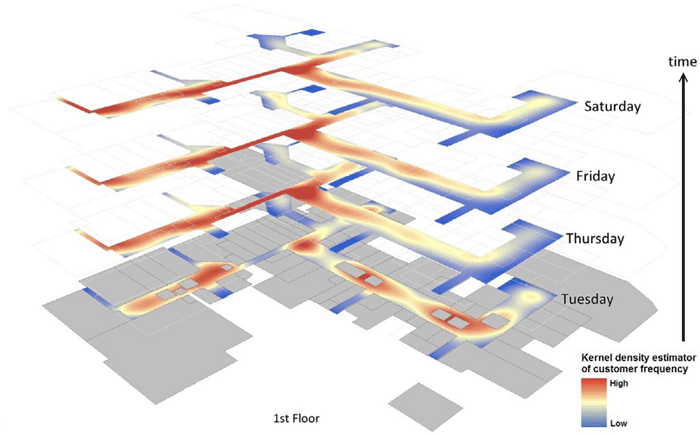
GIS and Small Business Planning
Small businesses increasingly use GIS for spatial analyses like kernel density estimation or Monte Carlo simulation to boost their success.

GIS and Underground Mining
GIS has been utilized to monitor tunnels and areas explored, as it provides both 3D visualization and abilities to integrate various sets of data for visual and quantitative analysis.

Using GIS to Choreograph Dance
Researchers at Ohio State University developed GIS software to help track the movement of dancers over time to see their patterns, which was also then used to choreograph new classical routines

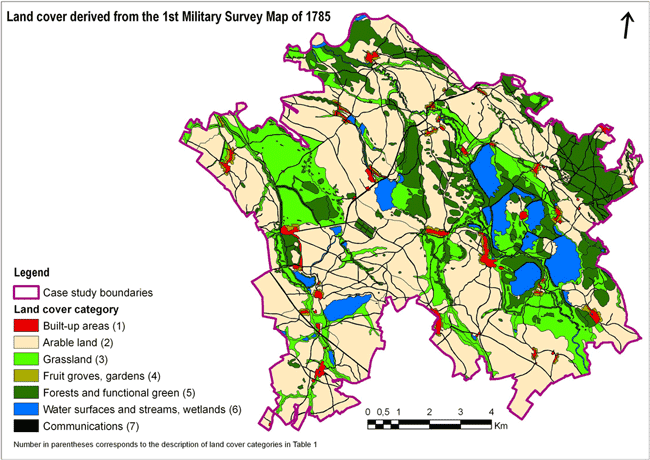
How GIS is Used to Understand History
Historical geography is one area that has applied GIS to understand outcomes of battles, why cities were built in given locations, and using ancient technologies to understand length and difficulty of travel at different times of the year.

GIS and CAD Integration
Mark Altaweel discusses efforts to create a truly integrated system, where CAD components and software concepts work with GIS data.

Personalized GIS
In personalized GIS, software is being developed to anticipate our needs and provide recommendations based on our behavior, past preferences, and the preferences of others.

GIS and Human Anatomy
Mapping and monitoring the human body in real time using GIS is one area of great opportunity for medical and healthcare professionals.

Multi-view GIS
Multi-view GIS provides different perspectives of space and time for a given geographic area.

Real-time Collaborative GIS
Real-time collaborative GIS (RCGIS) enables users, from domain experts to common citizens, to collaborate on given issues and share data easily through a distributed framework.

4D GIS and Prediction
For the last two decades, GIS technologies have increasingly been used to incorporate not only spatial relationships but also analyzing and visualizing space across time. Spatial-temporal GIS, or 4D GIS, has, in particular, become essential in areas where GIS is needed for predicting dimensions across time.

GIS and NoSQL Databases
Relational databases present some limitations to scaling, preventing or limiting the applicability of big data and real-time data problems utilized within GIS. More and more GIS software companies and developers are adopting NoSQL formats where data retrieval is generally faster and easier to structure. NoSQL also facilitates analysis and integration within a variety of tools, which is why open source GIS has proven to be the most useful arena for NoSQL databases.

GIS and Natural Language Processing
Within GIS, natural language processing can be utilized for spatial understanding of where events, places, or people may relate to a given phenomenon.
Proportional Hazard Modeling and GIS
By integrating GIS with proportional hazard modeling, we are now beginning to see GIS increasing its analytical modeling repertoire for the sciences that leverage factors of spatial and time to better understand how emergence and evolution of given processes develops, even when uncertainty is persistent for areas of research.

Agent-Based Modeling and GIS
The need to understand emergent phenomenon in a variety of fields has led to not only greater use of agent-based models (ABMs), but we are increasingly seeing tools that integrate GIS with ABMs.