
GIS Data
This category contains introductory text about GIS data such as types of error in GIS datasets, types of GIS data (raster and vector), and metadata.

Geoportals
Geoportals provide a single point of access for searching for and downloading GIS data from a multitude of sources. Users looking for GIS ...

Esri Launches Site to Find Open Data
Esri has launched ArcGIS Open Data as a portal for users to search, download, and visualize open data: Since July 2014, ...

The 25th Anniversary of the U.S. Census Bureau’s TIGER Project
It is something that many of us take for granted every day. If we need to find directions to an ...
Empowering GIS with Big Data
Analysis of Big Data in a geographic context has empowered organizations and businesses faced with huge amount of data and diverse technologies. The integration of maps with multiple layers of information tells the full story behind the data. Trends and patterns are revealed. Queries are answered and new questions are also addressed. At the same time, predictive modeling on massive datasets help drive accurate decision-making, profitability and effective resource management.
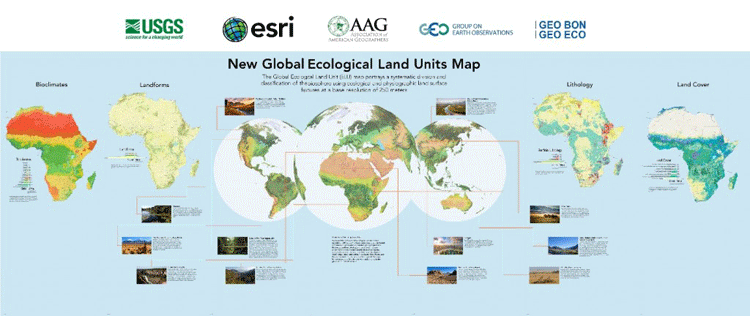
Global Ecological Land Units Map
Esri and the United States Geological Survey (USGS) have developed the highest spatial resolution ecological land units (ELUs) map of the world commissioned by the intergovernmental Group on Earth Observations (GEO).

Using Geospatial Technologies to Map Illegal Fishing
Worldwide overfishing is having a devastating effect on marine ecosystems. A 2014 report from the United Nations Food and Agriculture Organization ...

Mapping the California Drought with Open Data
The Center for Integrated Data Analytics (CIDA) of the United States Geological Survey has created an open source visual description of California's ongoing drought using free and publicly available GIS data sources

Using Drones to Create Fast Orthorectified Maps
Computer scientist Mark Pritt, along with colleagues at Lockheed Martin in Gaithersburg, Maryland, developed a new algorithm to handle thousands of images and speed up the process of creating an orthorectified map from UAV aerial imagery.

Using Citizens to Map Atmospheric Particulates
By leveraging data from over 8,000 smartphone users, Dutch researchers successfully mapped atmospheric particulate levels.

Land Cover GIS Data from the European Space Agency
The European Space Agency has released land cover maps covering the 2000, 2005, and 2010 epochs. Developed by ESA’s Climate Change Initiative ...

3D Maps for the Blind
The Geospatial Information Authority of Japan (GSI) is developing low-cost technology to print 3D tactile maps for the blind.

New Detailed Map of the Ocean Floor
More than two-thirds of the earth’s surface is covered by deep oceans, yet researchers know one hundred times more about ...

Best Practices for Successful GIS Data Management
Lowell Ballard, Director of Geospatial Solutions for Timmons Group, shares some of his experience on managing GIS data and growing a GIS program.

CryoSat Shows Record Loss of Polar Ice
Scientists concerned about climate change are closely monitoring the thickness of polar sea ice. For many years, ice cover has ...
GLOWABO – Remotely Sensed Inventory of the World’s Lakes
A team of researchers used remote sensing techniques to calculate the number of lakes in the world.

Improved and More Realistic Minecraft Map of Great Britain
An improved Minecraft map of Great Britain has been released by the Ordnance Survey.

Measuring Small Variations in the Earth’s Gravity
The NASA–German Grace satellites were launched in May of 2002 in order to map variations in Earth's gravity field.

Measuring Carbon Dioxide and Nitrogen Dioxide Trends with Remote Sensing
Researchers from the University of Bremen published in Nature Geoscience the results of an effort to implement a top-down approach using data acquired remotely.

National Geospatial-Intelligence Agency’s Web Mercator Advisory Notice
The National Geospatial-Intelligence Agency (NGA) has an advisory notice warning about errors in the widely used Web Mercator map projection.

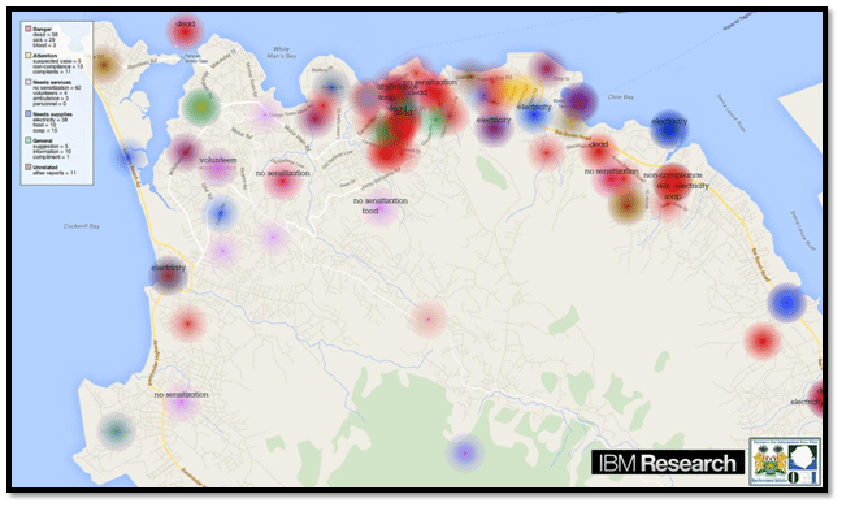
Mapping the Outbreaks of Diseases
In August of 2014, the World Health Organization declared a public emergency in response to the growing number of Ebola ...

Mapping Global Carbon Dioxide Emissions
Researchers recently published the results of developing a system for measuring global carbon dioxide (CO2) emissions in the Journal of Geophysical ...

Mapping Forest Disturbance with Landsat
The Landsat Ecosystem Disturbance Adaptive Processing System (LEDAPS) takes advantage of the 30 year Landsat archive to inventory recent disturbances and forest-cover change.

EarthCube Data Initiative
Improvements in technology have led to the wide dissemination of information. As long as you have a computer, tablet, or ...
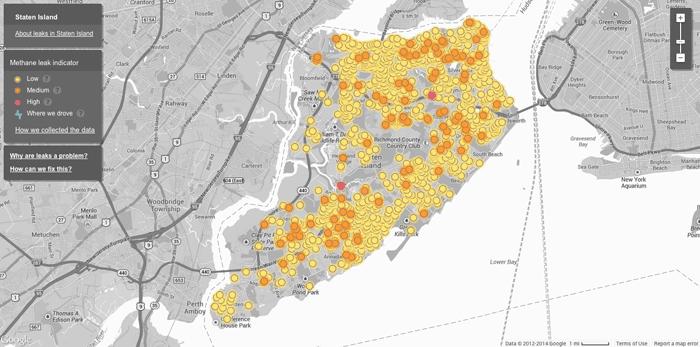
Mapping Methane Leaks with Google Street View Cars
Google partnered with the Environmental Defense Fund on a pilot project to use Google’s fleet of Street View cars to ...

No Drones Zones: Map and GIS Data
Unmanned aircraft, known more commonly as drones, have a blanket ban by the Federal Aviation Authority in the United States over military ...

Using Remote Sensing to Measure the Effect of Drought on Ground Water
This map shows a comparison of modeled relative amount of water stored in underground aquifers in the continental United States for July 7, 2014 as compared to the average for comparable weeks for the sixty year average water storage.