
GIS Data
This category contains introductory text about GIS data such as types of error in GIS datasets, types of GIS data (raster and vector), and metadata.

After the Map GIS Data Available
A bonus to the book, After the Map, is the companion site, www.afterthemap.info which offers access to all of the imagery, spreadsheets, and GIS data used in the book.

Building Missing Weather Data
Called the ENACTS (Enhancing National Climate Services) initiative, scientists are using satellite data in order to estimate rainfall, temperature, and other information to fill in a 15 year gap in climate data collection for Rwanda.

Why the Canadian Arctic Needs to be Mapped
The Canadian Hydrographic Service is in charge of mapping the Canadian Arctic, but they’ve only gotten about 10% of the way through Canada’s Arctic holdings.

Making Nottingham City Council’s Open Data Available
David A. Eagle, Managing Consultant takes a look at how 1Spatial helped Nottingham City Council harness FME in to streamline the availability of open data to the public, reducing its need to spend staff hours on Freedom of Information Act requests.

Using GIS and a Century of Data to Create a New Geologic Map of Alaska
In 2016, the USGS completed a new geologic map of Alaska using GIS.

GIS and Artificial Intelligence Used to Build Facebook’s World Population Map
Facebook has used a combination of existing GIS data, high resolution imagery, and artificial intelligence to develop a detailed population map of the world.

Automatic Acquisition of 3D City Models
This concept paper on the automatic acquisition of 3D city models was written by Venugopalan Nair who is the Senior Manager of Geo Spatial Services at SBL.
Transit Explorer: Mapping all of North America’s Transit Routes
Transit Explorer is a mapping application that visualizes current, planned, and proposed transit routes across Canada, the United States, and Mexico.

What is a Shapefile?
The shapefile format is now a common format for storing GIS data. Shapefiles store non-topological vector data along with related attribute data.

Using Remote Sensing to Count Trees
Tree count management using remote sensing techniques is important for sustaining conservational stability and ecological biodiversity.

Cloud Computing Used to Analyze Landsat Imagery and Detect Deforestation
Landsat, NASA’s longest running initiative for the acquisition of Earth imagery, has generated nearly 50 trillion pixels of data by capturing one image per season, of every place on Earth, for the past 43 years, providing a treasure trove of data for researchers.
Researchers: Satellite Imagery Could Boost Wildlife Conservation
An increased number of scientists, conservationists and technology scions are banding together to use their various strengths to benefit conservation efforts to track global biodiversity.

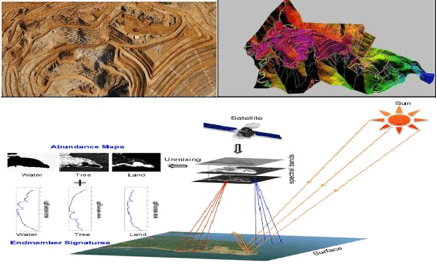
Five Applications of Satellite Data
To illustrate the benefits, here are five uses of satellite imagery and data.

Extracting 3D GIS Data
This piece by Anil Narendran Pillai, Vice President of Geomatics at SBL, takes a look at 3D GIS data creation using feature extraction methods.

Measuring the Number of Trees in the World
Using a combination of satellite imagery, forest inventories, and supercomputer technologies, researchers estimate there are 3.041 trillion trees in the world.

Processing UAV Imagery and its Applications
This article highlights the steps for processing Unmanned Aerial Vehicles (UAV) imagery and GIS data acquisition and discusses areas of applications.

River Width GIS Data Created from 1,756 Landsat Images
Researchers used 1,756 Landsat images to develop a GIS database of river widths for the entire North American continent.
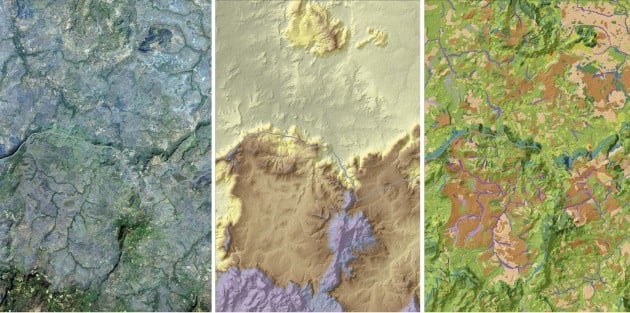
A Brief Introduction to Photogrammetry and Remote Sensing
The following is a brief introduction to photogrammetry and remote sensing for those who are new with the technology, written by Anil Narendran Pillai, Vice President – Geomatics at SBL.

First Satellite Images from Sentinel-2 Delivered
Four days after its launch, the first images from Sentinel-2 have been delivered. Covering an area from central Europe and the ...

Landsat 8 Data Users Handbook
Launched in 2013 by NASA, Landsat 8 is the latest satellite in the series. The mission of the orbiting satellite is ...

Using Drones to Protect Indigenous Lands
Indigenous Dayaks in Setulang, Indonesia are using drones to quickly and cheaply map their territories for defending against trespassers.

Black Holes No More: The Emergence of Volunteer Geographic Information
This essay by Ron Mahabir takes a look at how crowdsourced mapping efforts are helping to fill in much needed geographic information about impoverished areas around the world.

Keys to Successfully Managing GIS Data Health and Quality
Jennifer Kennedy, a GIS Analyst at Timmons Group discusses the importance of managing GIS data quality and some GIS solutions for managing GIS data and ensuring its integrity.

Big Data, GIS, and Bikes
The Oregon Department of Transportation (ODOT) has set a precedent for public agencies across the country with the purchase of ...

LiDAR and Rail Utility Mapping and Digital Asset Preparation
Venugopalan Nair, Senior Manager, SBL, discussed why LiDAR is an efficient and quick technology for mapping rail utilities.

Maps Serve to Monitor Global Agriculture
As the world’s population grows, the amount of land available for farming is becoming a major concern. Increasing competition for ...