
A flow map is one technique used by cartographers to show the movement, or flow, of geographic data. A type of thematic map, a flow map can show the flow of people, animals, or goods, to name a few examples. Flow maps are also used to visualize the volume and types of flow between one place and another.
Flow maps come in different forms. One common type of flow map is called the radial flow map. Radial stems from the medieval Latin word, radialis, meaning shaft or rod. On a radial flow map, lines arc out from an origin point to connect with an end point. These types of maps were popularized by airlines in order to show their routes.
What data is needed to create a radial flow map?
Radial flow maps can easily be created in QGIS with a few steps to prepare the data needed. In order to create a radial flow map, a table containing the following columns is the minimum amount of data that is needed:
- Origin point with X, Y coordinates stored in separate columns
- End point with X, Y coordinates stored in separate columns
Additional columns of data can be added such as:
- the volume of flow
- type of flow (example of this is a migratory bird flow map then the type of species may be recorded)
Radial Map Data Example: Flow map of metro to metro migration within the United States
The U.S. Census Bureau calculates estimates of internal migration within the United States as part of its suite of American Community Survey (ACS) data. This is the flow of residents from one part of the country to another. Internal migration is measured at different levels of geography, one being the movement of people from one city area to another.
Get the U.S. Census metro migration table and GIS data
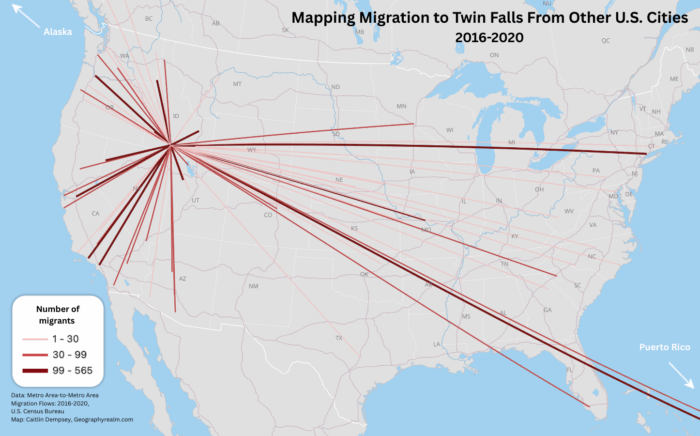
For this GIS tutorial, we will be using the Metro Area-to-Metro Area Migration Flows: 2016-2020 table which quantifies estimate in, out, and net migration for the metro areas of the United States. More specifically, we are going to create a radial flow map showing the volume of migration from other U.S. cities to Twin Falls, Idaho. The U.S. Census Bureau estimate about 4,059 people moved from other areas of the country to this metro area between 2016-2020.
From the Metro Area-to-Metro Area Migration Flows: 2016-2020 table, copy just the rows and columns for the records for “Twin Falls, ID Metro Area” and remove any metro record with zero migration. Create a new CSV file and label the columns. Here is a truncated view of the table you should have created:
| EndCity | StartCity | EndName | StartName | TotalMigrants |
| 46300 | 10380 | Twin Falls, ID Metro Area | Aguadilla-Isabela, PR Metro Area | 152 |
| 46300 | 11260 | Twin Falls, ID Metro Area | Anchorage, AK Metro Area | 15 |
| 46300 | 12020 | Twin Falls, ID Metro Area | Athens-Clarke County, GA Metro Area | 4 |
| 46300 | 12420 | Twin Falls, ID Metro Area | Austin-Round Rock-GeorgeTown, TX Metro Area | 5 |
| 46300 | 12540 | Twin Falls, ID Metro Area | Bakersfield, CA Metro Area | 87 |
| 46300 | 12580 | Twin Falls, ID Metro Area | Baltimore-Columbia-Towson, MD Metro Area | 1 |
| 46300 | 13460 | Twin Falls, ID Metro Area | Bend, OR Metro Area | 2 |
| 46300 | 14260 | Twin Falls, ID Metro Area | Boise City, ID Metro Area | 565 |
| 46300 | 14740 | Twin Falls, ID Metro Area | Bremerton-Silverdale-Port Orchard, WA Metro Area | 2 |
From Data.gov access the GIS data filed called tl_2020_us_cbsa that contains polygons of the metro areas in the United States (the U.S. Census Bureau’s Core Based Statistical Areas (CBSAs) is a combination of the agency’s Metropolitan and Micropolitan Statistical Areas). Within this file is an attribute called “GEOID” that contains the five-digit metro code for each area that corresponds to the start and end metro areas in the table above.
Transform the metro area GIS data
The first step in this GIS tutorial is to create the GIS data that contains the start and end points that anchor reach radial line along with the attribute values that will be used to symbolized the volume of migration from U.S. cities to Twin Falls, Idaho.
Start up a new QGIS session and add the tl_2020_us_cbsa shapefile to the map panel. Either locate the shapefile where you saved it on your computer or open up the file directory and drag and drop the .shp file into your QGIS session.

Calculate centroids from the metro area polygons
The Core Based Statistical Areas (CBSAs) for metropolitan and micropolitan areas in the United States are represented as polygons. In order to create great circles, we need to connect the arcs using two end points. For this tutorial, we will be using the center of each metro area as endpoints.
From the top menu on QGIS, select Vector –> Geometries –> Centroids…

From the Centroids interface, make sure you have the tl_2020_us_cbsa shapefile selected. The default is to save this calculation as a temporary layer. Click on the ellipsoid (…) next to the grayed out [Create temporary layer] and then navigate to the folder where you want the new shapefile to be written to and create a name for the layer. Click save.

Click the Run button in the Vector Geometry – Centroids window. (Note: after saving the output file, the window may move behind the map view.) Once the process completes, close the window. The new centroid layer will appear in the map view
Join metro migration data to geographic centroids
Next it’s time to join the CSV file containing the metro migration data to the geographic centroids.
Drag and drop the CSV file into your QGIS layers panel.

Then right-click on the metro centroids layer and select properties, which is the last item on the menu. From the properties interface, select the Join option and then click on the green plus icon.

In the Add Vector Join interface, select the CSV file as the join layer. For the join field, select the column containing the values for the metro code from the CSV file. For the target field, select the GEOID column which contains the matching metro codes from the centroids layer.

Click the OK button to close the Add Vector Join interface. Then click the OK button in the Layer properties interface to complete the join process.
Next, right-click on the centroids layer and select Open Attribute Table. Verify that the join was successful by making sure the fields from the CSV file were appended to the centroids point layer. The StartCity column was joined to the GEOID column in the centroid layer and the four additional columns from the CSV file have been added to the attribute table.

Adding geographic coordinates to the centroids layers
The final step in preparing the data for generating radial flow lines is to add geographic coordinates to the attribute table. The starting coordinates represent the location of the metro area where the migrants originated. The ending coordinates are the same for all records, which is the location of Twin Falls, Idaho.
To add the X,Y coordinates for each start location, add the Processing Toolbox from the View –> Panels menu option. Then in the Processing Toolbox search bar, type in “xy” and then double-click on “Add X/Y fields to layer” from the results.

In the Vector Table – Add X/Y Fields to Layer window, select the centroids as the input layer, select the coordinate system you want to apply, and designate a new shapefile name and location. Next click the Run button.

When the process has finished running, click on the Close button. Now if you look at the attribute information for your centroid file, each record has attributes with two additional fields containing X and Y coordinate values.
These coordinate values are the starting points for each radial line. We need a second set of X and Y coordinates added to each record for the end point, which is the location Twin Falls.
To do this, open up the attributes for the new metro shapefile and search for the Twin Falls Metro Area record. Right click on the X coordinate and copy the value.

Next click on the Open Field Calculator button which looks like an icon of an abacus.

The next step is to calculator the X coordinate value for Twin Falls, Idaho for each record in the metro centroid layer.
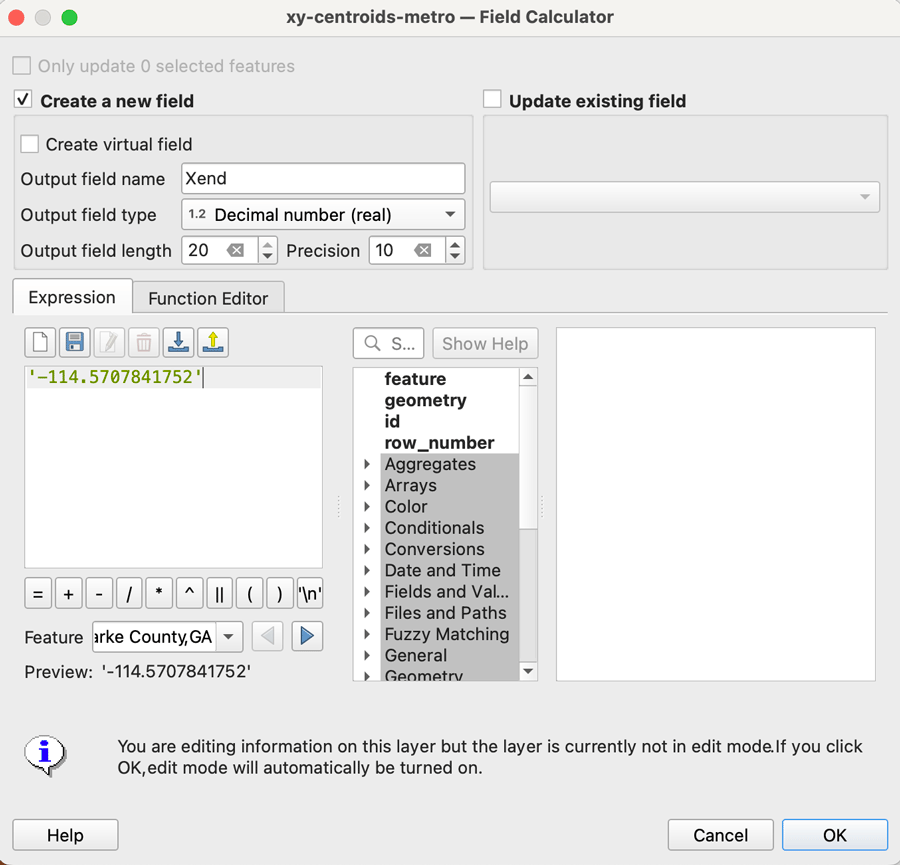
Make sure the Create a new field box option is checked. Then give the new field a name such as “Xend”. Change the Field Type to Decimal Number and adjust the Output field length (to 20) and Precision (to 10).
In the Expression window, type in a single quote (‘) and then paste in the value you copied and close it with another single quote. Click on the OK button to run the calculation and click the Save Edits icon.
Repeat the process to add the Y coordinates to a new field called Yend by copying and pasting the Y coordinate value from the Twin Falls record and running the field calculator. Click the Save Edits icon again. Click the pencil icon to turn off editing mode for the attribute field.
You can verify that the values were correctly added by browsing through the attribute records. Each record should now have a set of starting coordinates for each specific metro area and ending coordinates matching the coordinates for Twin Falls.

Filter for only records with migrants
Not all metro areas in the United States had residents that moved to Twin Falls, Idaho. Of the 939 metro areas, only 64 had someone migrate to Twin Falls. We want to filter our metro centroids layer to only show centroids that had at least one person move to Twin Falls.
Right click on the centroid layer and select Filter from the menu. Next, filter out all locations where the field value for the number of migrants is 1 or greater. In the example below, the expression to use would be: “twin-fal_3” >= ‘1’.

XY to Line
To create a vector layer with lines connecting the metro areas with migrants to the single location of Twin Falls, you will need to add the QGIS plugin Shape Tools. From the top menu item select Plugins –> Manage and Install Plugins…
From the Plugins interface, search under All for Shape Tools. Click on the search result for Shape Tools and then click the Install button. The menu for Shape Tools can then be accessed from the Vector menu.
To create the great circles, go to Vector –> Shape Tools –> XY to line.

In the Vector Geometry – XY to Line window set the parameters: choose the point layer, select the projection for input and out layers, and select the fields for the starting and end points. For Line Type select Great Circle to generate lines with an arc.
The default is to create a temporary layer so select a location and name of the output line file. Since the input centroids doesn’t have the location of Twin Falls, check the Show ending point box. This will generate a single point for Twin Falls.

Click Run. Next click Close once the calculations have run.
Radial flow map: Migration to Twin Falls From Other U.S. Cities
The final step is the symbolize the radial line by line thickness and/or color in order to visually represent migration patterns. Add underlying base layers for context. Click on the map below for a larger PDF version.
