
Mark Altaweel

Magnetometers and Navigation
A new form of magnet being developed is aiming to make magnetometers not only provide direction of travel but also precise location information.

Open Geospatial Data and COVID-19
Some of the key GIS datasets being used today for research and outreach related to COVID-19 are assessed and reviewed.

Recent Developments in Remote Sensing and Earth Observation
Remote sensing and earth observation capabilities at satellite, aerial, UAV, and ground levels have radically improved in the last decade.

How Geospatial Technologies are Helping to Complete the Effort to Map the World’s Ocean Floor
Only 20% of the ocean's floor has been mapping in detail.

GIS and the Future of Public Health
Mark Altaweel takes a look at how GIS is used in public health and where GIS and public health will be in the future.

QGIS and Free Mobile Applications
The capabilities of QGIS can be extended with plugins and mobile GIS apps.

Marketing and Rebranding GIS: Opportunities for GIS Professionals
GIS professionals need to emphasize more than just their geospatial skills when marketing GIS to organizations.

Python and Geospatial Analysis
Two recent podcasts from MapScaping take a look at the use of Python in geospatial analysis.

The Earth Archive Project and 3D Mapping the Earth
The Earth Archive Project, launched in 2019, is a project that will provide a detailed 3D map of the entire Earth.

Mapping the Impact of Human Activity
Different methods have been utilized by landscape ecologists to map and study the Earth’s relationship to human activity.
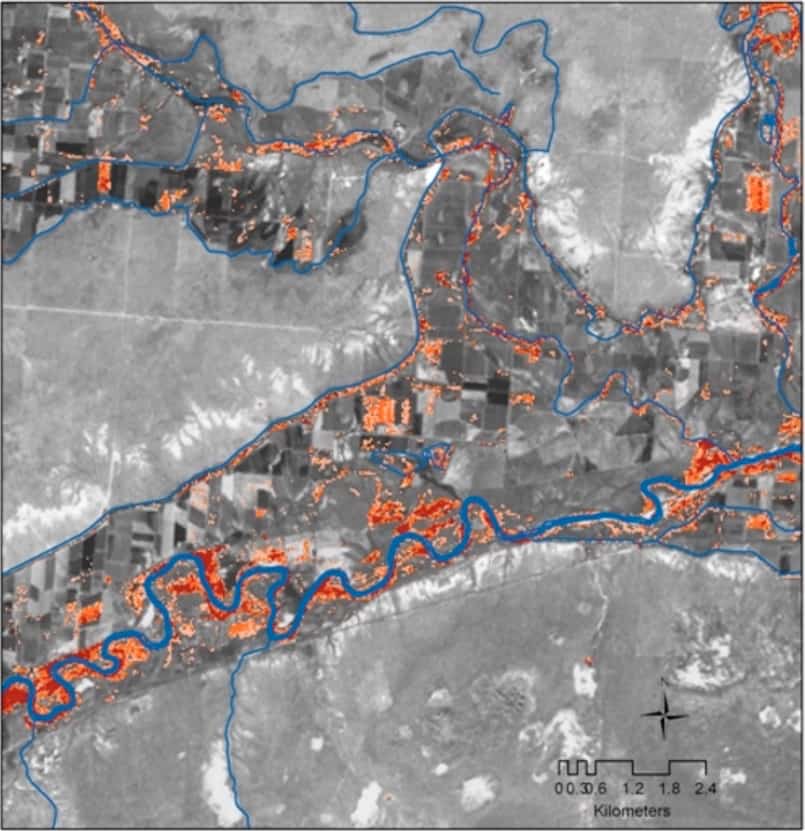
Using Remote Sensing to Map Invasive Species
Scientists and researchers are increasingly using remote sensing methods to map and track invasive species.

Monitoring Volcanoes Using UAVs
With the increase usage of unmanned aerial vehicles (UAVs), or drones, scientists now have a powerful tool to map active volcanoes safely.

Mapping the Amount of Snow on Arctic Sea Ice
Scientists are using satellite data to measure and map the amount of snow on Arctic sea ice.
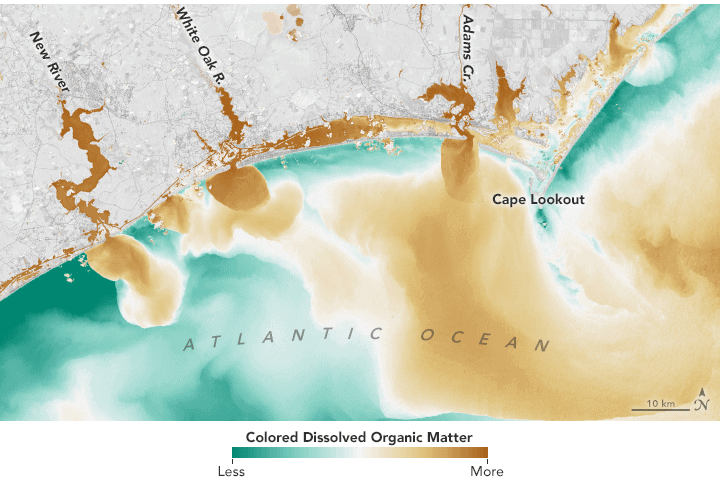
Monitoring Lakes Using Remote Sensing Data
Satellite-based remote sensing is proving to be a useful tool to allow effective monitoring of lakes around the world.
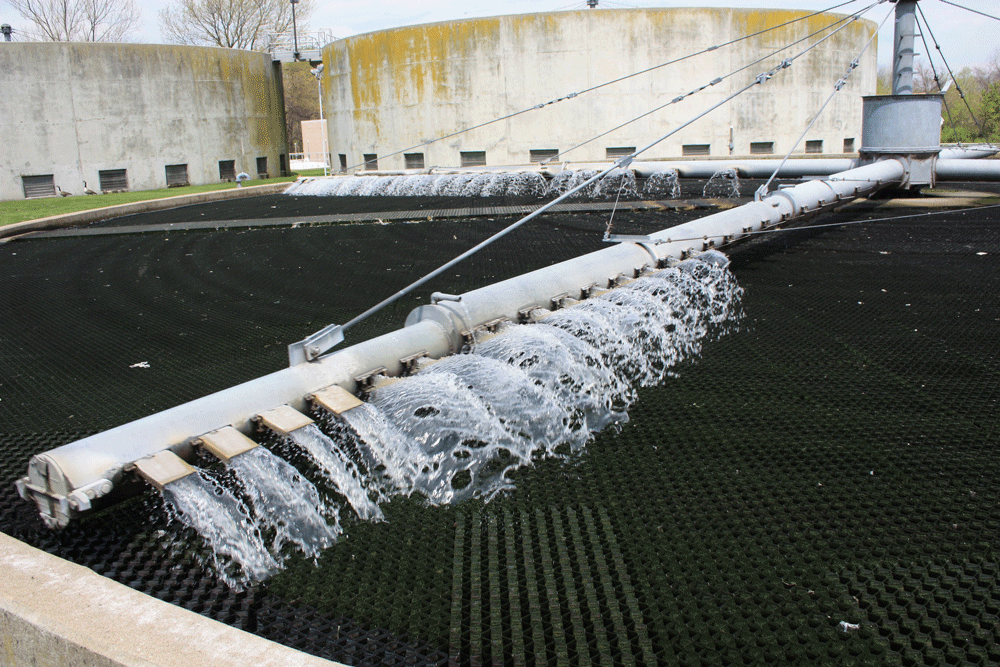
Tracking COVID-19 Through Sewage, Air, and Thermal Cameras
Given the limitations of testing, companies and researchers are using different proxies to better understand the extent of COVID-19.

Using Mobile Phone Data to Limit the Spread of COVID-19
Mobile phone data could be used to limit the spread of the virus while medical experts can also use it to project next steps in fighting a pandemic.

Using Geospatial Technologies to Map Locust Swarms
Using a combination of satellite and UAV monitoring, the impact of locusts can be minimized by anticipating where swarms are likely to form next.

Satellite Mapping of Oceans and Coral Reefs
In 2018, NASA launched the ICESat-2 satellite to monitor levels of ice. Researchers have found that this satellite can also measure coral reef systems.

Using Geospatial Technologies to Map and Track Food Supply Chains
Geospatial and Big Data firms such as Orbital Insight are using and combining satellite data, cellphone geolocation data, and UAV data to track food supply chains.

New Satellite Technologies to Monitor Volcanoes and Earthquakes
One relatively new satellite is a small satellite system called the CubeSat Imaging Radar for Earth Sciences (CIRES).

Using Location Data to Map People’s Movements, Social Distancing Efforts, and the Spread of COVID-19
As the COVID-19 pandemic continues, mobility data is being used to track and map out social distancing compliance and track the spread of the coronavirus.
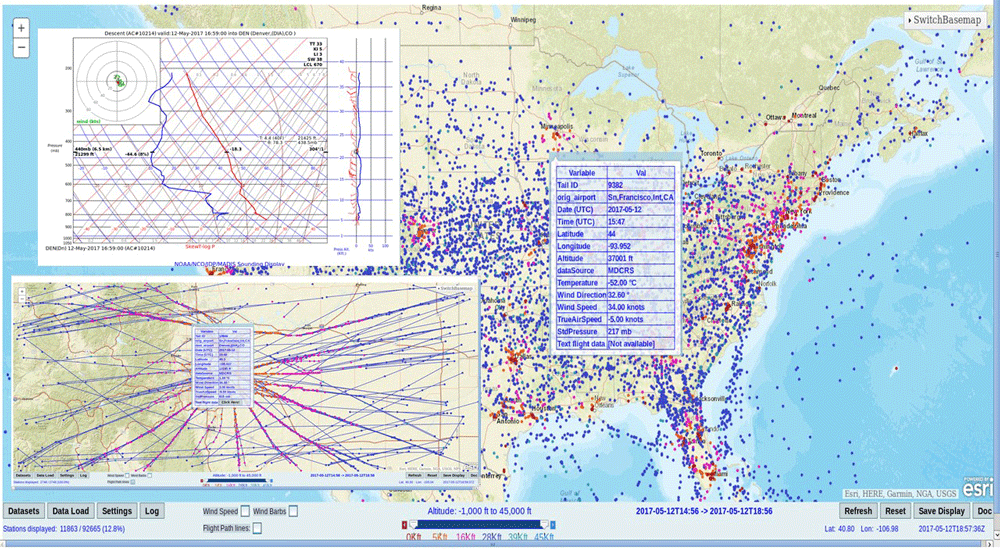
How Weather Forecasting is Affected by Coronavirus-Related Flight Cancellations
Grounded flights due to the coronavirus pandemic is resulting in far fewer aircraft weather observations and less access to repair remote weather stations.

Computer Vision in the Time of the Coronavirus Outbreak
Computer vision is emerging as a promising set of techniques such as enabling rapid detection of COVID-19 and the better monitoring of social distancing practices among people.
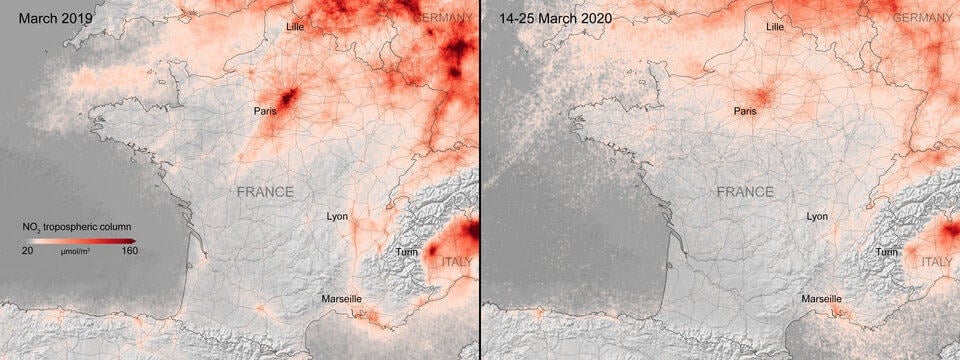
Mapping Changes in Air Pollution During the Coronavirus Pandemic
Satellite imagery also confirms many countries are seeing a strong downward trend in air pollution during the coronavirus outbreak.

Geolocation Data, Geofencing Warrants, and Crime
With most adults carrying mobile devices that have GPS tracking capabilities, mapping our movements has never been easier.

Geography of Quarantines
Geographic research can be used to assess the effectiveness of past quarantines in controlling viral diseases.