
Maps and Cartography
Maps and cartography are essential tools in geography that enable us to visualize and understand the Earth’s surface and its features.
Cartography is the art and science of creating maps, which involves the use of sophisticated technology and techniques to accurately represent the Earth’s physical and cultural features.
Maps provide a visual representation of the world, allowing us to identify patterns, explore spatial relationships, and navigate through unfamiliar terrain.
Tissot’s Indicatrix: Measuring Distortion in Map Projections
Tissot’s indicatrix is a mathematical contrivance used in cartography to characterize local distortions in map projections.

Review | Oxford Atlas of the World, 24th Edition
G.T. Dempsey reviews the Oxford Atlas of the World. The 24th edition is scheduled to be published November, 2017.

Can Painting City Streets Reduce the Urban Heat Island Effect?
The City of Los Angeles is experimenting with lowering the urban heat island effect by painting its streets a lighter color.

Animated Map Shows Animal and Bird Migrations
Scientists modelled animal migrations based on global climate change patterns and created a map that showed potential future migrations of different species in North, Central, and South America.

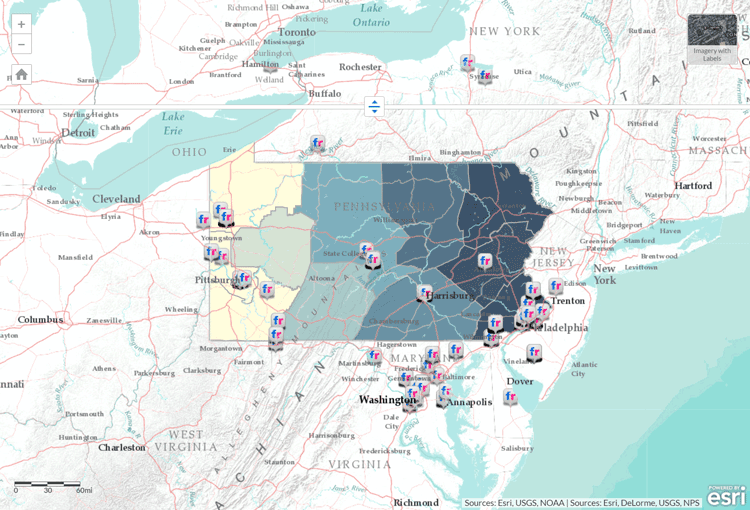
You Can Help the Humanitarian OpenStreetMap Team With Its Research on Crowdsourced Damage Assessment
The Humanitarian OpenStreetMap Team recently launched three formal research experiments on crowdsourced damage assessment and is seeking volunteers interested in participating.

One of the Largest Atlases in the World is Accessible Online
One of the largest atlases in the world, the Klencke Atlas dating from the 1660s, was digitized by the British Library and is now viewable online.

Noise Pollution and Geography
Noise pollution has long been seen to be particularly acute in regions where transportation and urban development are most pronounced; the disciplines of urban and environmental geography have focused on this topic.
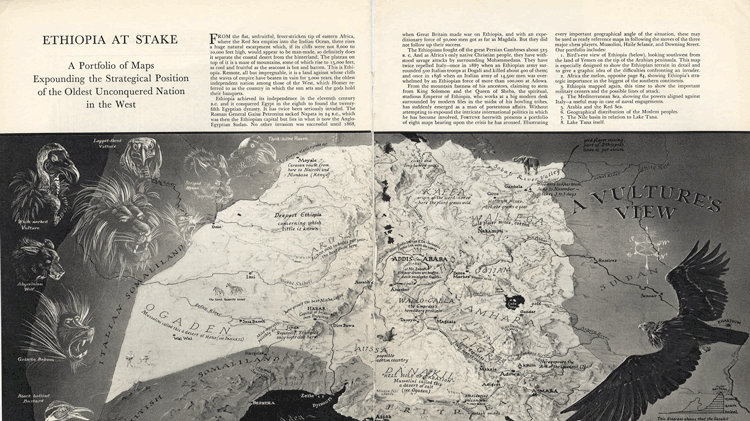
Persuasive Cartography: How Maps are Used to Shape Our Beliefs
Persuasive cartography involves making maps that attempt to shape our beliefs.

This Globe Unfolds Like an Umbrella
John Betts's 15 inch (37.5 cm) diameter collapsible globe expanded much like the mechanism by which an umbrella unfolds.

How to Find the Latitude and Longitude of a Location Using Google Maps
This tutorial will take you step-by-step through the process of finding the X,Y coordinates of a specific location using Google Maps.
Early Data Visualization Pioneers
RJ Andrews created DataViz based on his collected notes to provide readers with insight into five of the earlier pioneers of data visualization.
Using Geolocation to Connect Geography with Genealogy
The ability to create a potential geographic scrapbook could add a new dimension to the popularity of genealogical research.
Geography of Google Search
Explore Adventure analyzes where and when people in different countries search for locations in other countries.

Teaching Context When it Comes to Map Projections
Context is needed in teaching about distortion created by different map projections.
Parts of the World That Cartographers Keep Forgetting Exist
Some places and countries seem to be frequently left off of maps because cartographers keep forgetting they exist.

Sign Language on Maps
The Atlantic Provinces Sign Language Place Names map is an interactive map with place names described in American Sign Language, commonly used across the United States and Canada, as well as a regional dialect known as Maritime Sign Language.
Geography of Science
Despite the role of the Internet in allowing greater global connectivity, local geography still plays a dominant role in shaping science.

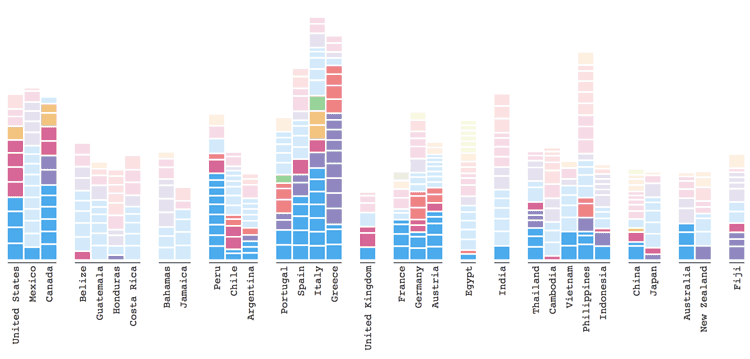
Geography of Global 500 Companies in 2016
Find out which countries, cities and US states have the most Global 500 countries in 2016.

View the Human Footprint on this Rotating Globe
View the global human footprint map developed from 180,000 satellite images.

Mapping Urban Trees Using Google Street View imagery
A project by the MIT Senseable City Lab, dubbed Treepedia, has mapped the amount of trees that were growing in major urban areas.

This Map Shows That By 1907, Only 11 Car Trips Across the United States Had Been Made
In 1907, a three-volume publication of the Blue Book included a map showing the 11 recorded transcontinental trips that had been made to date.

Habitat Fragmentation: A Multi-Scale Approach detailing its lasting impact on Earth’s ecosystems
An analysis performed at multiple spatial and temporal scales argues that destruction and degradation of natural ecosystems are the primary cause of global declines in biodiversity.

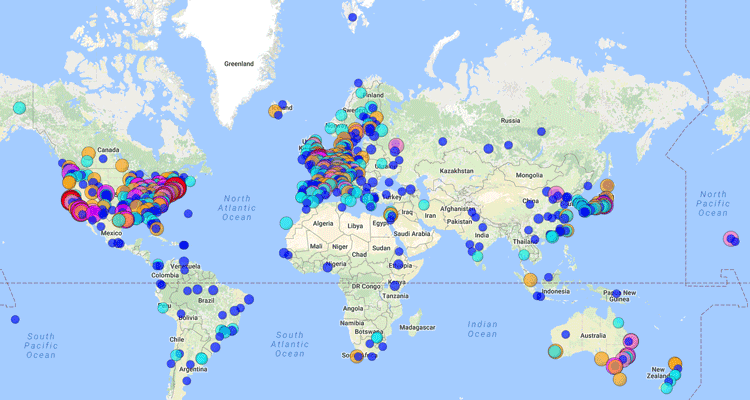
Using Geotagged Photos to Map Cats
I Know Where Your Cat Lives is a project that mapped out a million geotagged photos of cats from several social media platforms.

Changing Map Scale Using a Pantograph
A pantograph was one of the ways used to either reduce or enlarge the size of a map while reproducing an accurate copy of the original map.

Match Scribbles to Features on the Earth
Land Lines is an experimental online tool that matches drawn gestures on the screen with landforms extracted from satellite imagery.

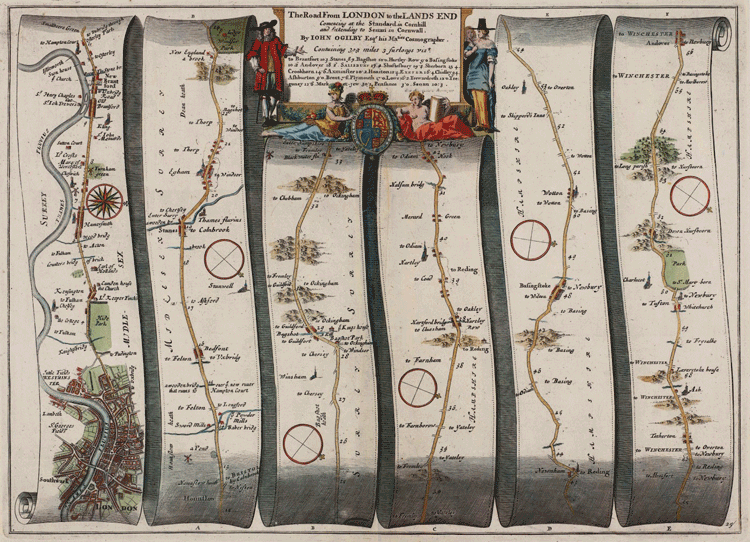
Seven Intriguing Maps from 2016
Here is a handpicked selection of seven of the most intriguing maps published online and in print in 2016.