
Spatial Analysis
The spatial analysis category looks at data manipulation techniques in GIS.
Measuring Vegetation from Satellite Imagery with NDVI
Normalized difference vegetation index (NDVI) is a remote sensing technology that measures vegetation kinds and growth by measuring vegetation fingerprints.

GIS and Stratified Heterogeneity
A method to measure uneven distribution of landscape or population features in a given space is stratified heterogeneity.

Teaching Math with GIS
GIS has enormous potential to be used for teaching mathematics to students.

A New Algorithm to Find Wildfires When It’s Cloudy
New technology called the Firelight Detection Algorithm, or FILDA, can help detect wildfires at night even when the skies are cloudy.

GIS and Spatial Autocorrelation
Spatial autocorrelation statistics have become incorporated into commonly used packages such as ArcGIS as well as open source software such as GRASS and QGIS.
GIS and Topic Modeling
Topic modeling is a thriving field in humanities and social sciences, with GIS being use to identify trends in social media.

How the ‘Quirky Geography’ of ZIP Codes Obscured Flint’s Lead Problem
Richard Casey Sadler, an assistant professor at Michigan State University discusses how the Michigan Department of Health and Human Services' reliance on using ZIP Code level data obscured the link between Flint residents and lead exposure.

A Global Landslide Potential Map That Updates Every 30 Minutes
Researchers from NASA have developed a global landslide susceptibility model that maps out areas in danger of potential landslides every thirty minutes.

Understanding Ocean Wave Patterns from Satellite Imagery of Sun Glitter
Researchers have developed a method by which to translate satellite imagery of sun glitter on the water into data about the direction, height and movement of waves.
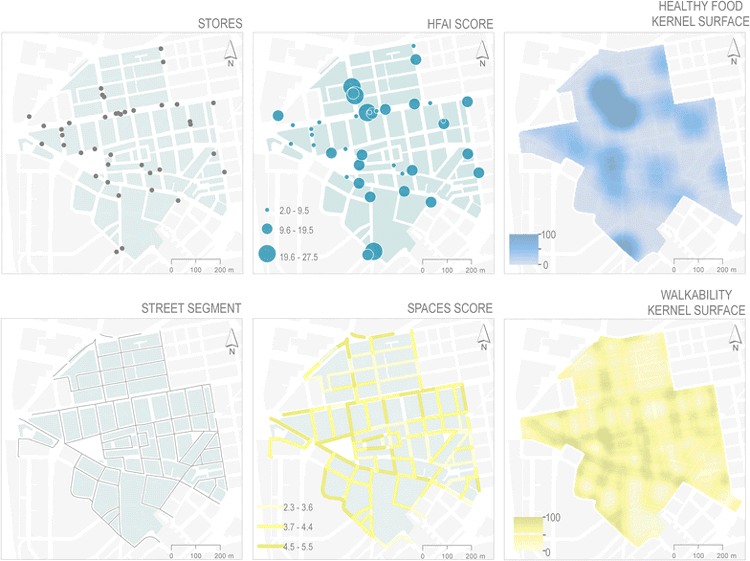
GIS and Obesity
GIS has been used to measure the built environment and its relationship to obesity.

GIS and the Geography of Religion
GIS has become an important historical and contemporary analytical tool used to explain past and current social trends shaping and being shaped by religions.
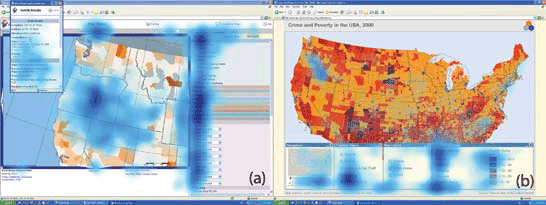
Analyzing Eye Movement For Better Map Design
With new and growing areas where eye monitoring and GIS can be utilized together, big data techniques will be a leading way in which visual and analytical understanding of spatial cognition will be understood in coming years.

Using Visual Search to Find Geographically Similar Features on Satellite Imagery
Descartes Labs recently unveiled its GeoVisual Search application which uses machine learning to visually search satellite imagery for similar geographic features.

Tracking Deforestation by Measuring the Distance to the Nearest Forest
Using satellite images, researchers established a method of calculating the distance between any point in the continental United States and the nearest forested area.

How GIS Can Help With Football Game Analysis
Football, or Soccer, is a spatial strategy game involving tactical player movements, which can be analyzed effectively using Geographic Information Systems (GIS).

Creating Non-contiguous Cartograms
Non-contiguous cartograms are a type of area cartogram. In a non-contiguous cartogram, the features are not connected and enlarge or shrink based on a quantified value.
Using GIS to Analyze the Death of Distance Hypothesis
Recent studies using GIS show that geographic factors continue to play a strong role in regulating social, economic, and general Internet use despite technologies that was purported to mitigate the effect of distance.

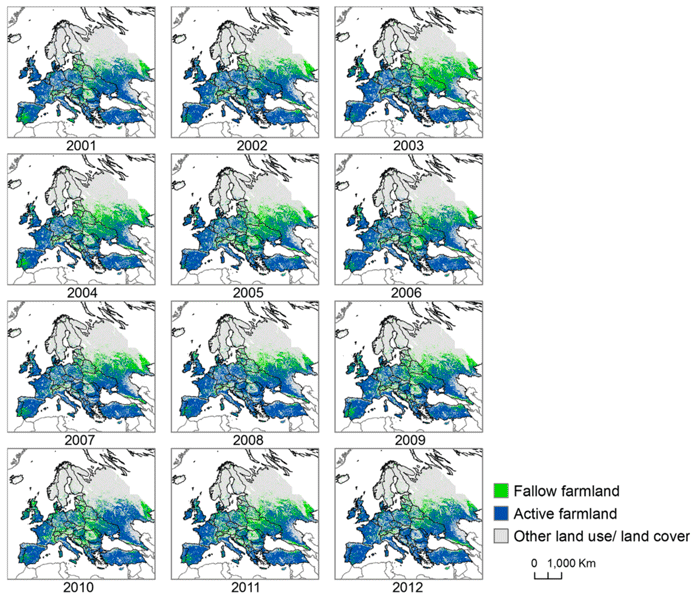
Using Machine Learning and Satellite Imagery to Estimate Corn Crop Production
Descartes Lab, a start-up organization, has created crop production analysis that uses millions of satellite images and machine learning to produce accurate data about the production of agricultural crops.

Using GIS to Understand Species Evolution
Studies have used spatial modeling and GIS approaches to understanding species evolution.

GIS and Innovations in Machine Learning
Machine learning or artificial techniques has been rapidly transforming many areas related to GIS and spatial applications

Using Remote Sensing to Understand the Correlation Between Deforestation and Forest Fires
MAAP has used remote sensing to discover a correlation between deforestation and forest fires in Tampbopata, Peru.

How Spatial Modeling Can Help with Refugee Aid
GIS is being used to address the spatial problem of allocating resources and constructing refugee camps.
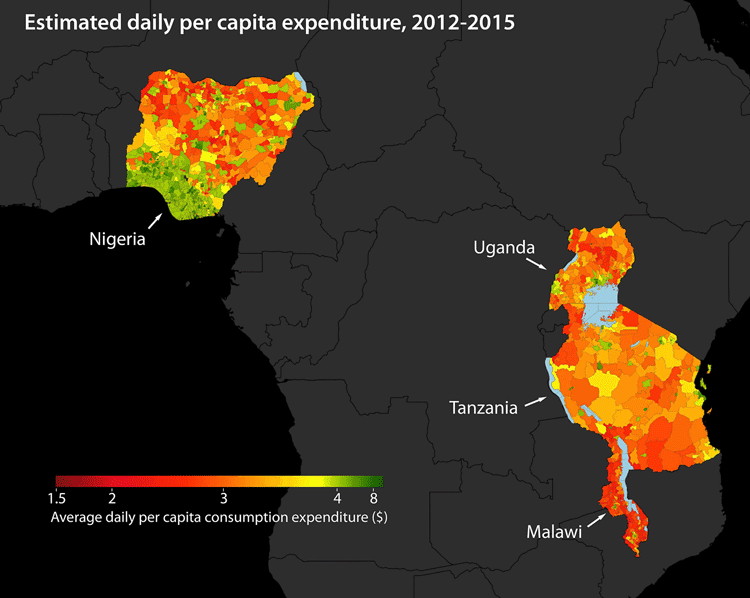
Using Machine Learning to Map Poverty from Satellite Imagery
Satellite images are now being used to map poverty levels around the world using machine learning used to analyze specific poverty data using a convolutional neural network.

GIS and Anti-Crime Measures
This article takes a look at methods which demonstrate the wide and growing field of crime prevention utilizing spatial and GIS approaches.

Using Satellite Data to Calculate Groundwater
A computer algorithm has been developed at Stanford University that allows researchers to determine groundwater levels using satellite imagery.

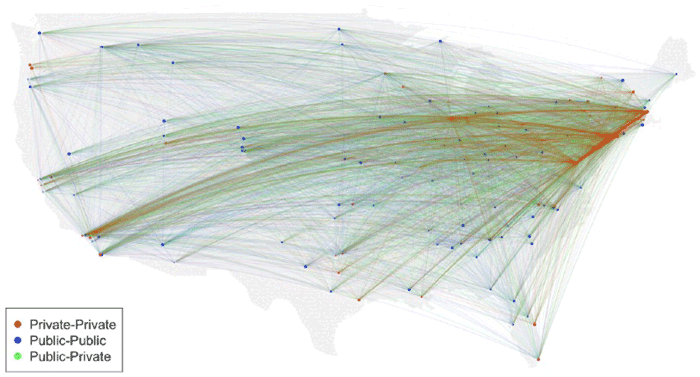
GIS, Elections, and Politics
Political geography focuses on past election cycles in order to look at how voting patterns develop and why. Mark Altaweel discusses how GIS can be used to study those patterns.