
climate change

Researchers are Using Machine Learning to Better Predict Weather Patterns
The enormous amount of data from Earth-observing satellites is pushing researchers to use machine learning to mine the information and improve climate models.

3D Model of the Movement of Carbon Dioxide Through Earth’s Atmosphere
NASA has created a model of the way carbon dioxide moves through Earth’s atmosphere.

Tree Migration Direction Affected by Climate Change
Ecologists have found that climate change, as it changes precipitation levels and temperatures, is causing trees to grow in different locations than they have traditionally taken root.

Coral Bleaching of the Great Barrier Reef
The Great Barrier Reef has undergone two severe bleaching events in successive years. This has been caused by the warming of the oceans due to climate change.

Model Predicts Economic Damage from Climate Change to be Greatest in the South in the US
A new model maps out the agriculture, crime, coastal storms, energy, human mortality, and labor costs of climate change in the United States.

Study Examines Trends in Global Warming
A multi-institutional study has recently come out with new research that studied the temporary slowdown of rising temperatures around the Earth.

Adapting to Live in a Hypersaline Environment
In their field work, the Iranian and French researchers encountered a Günther’s sea snake in the Persian Gulf, beyond what was thought to be its geographical range.

NASA: September 2016 Warmest on Record:
Nasa’s Goddard Institute for Space Studies (GISS) has announced that September 2016 was the warmest September ever recorded around the globe.

Storing Carbon in the Soil Through Regenerative Farming
In partnership with scientists and researchers, farmers are coming up with different ways to keep soil from degrading and releasing more CO2 into the air.

Mangrove Ecosystems’ Importance and Vulnerability to Climate Change
Scientists in Australia have discovered that mangrove ecosystems in Queensland are dying at rates that have never been seen before.

Climate Explorer Tool Offers Local Climate Change Maps and Models
Climate Explorer is tool created by a collaboration of many federal agencies that allows users to explore future changes in temperature, precipitation, and heating and cooling days.

Antarctic Sea Ice Growth: A Climate Change Paradox
Over the course of the last few years, the growth of Antarctica’s sea ice was well documented while the Arctic has experienced ice melt. Different accounts have been given for the paradox at Earth’s poles.

How Climate Change Is Shifting Sierra Nevada Forests to Higher Elevations
Climate change is causing certain key species in the Sierra Nevada mountains to change where they are growing according to a study published by the journal California Fish and Game.

Climate Refugees
Another kind of refugee situation is growing, one that has nothing to do with politics or wars that displaces people almost indiscriminately, and without regard to factors other than geographic circumstance. This is climate change, and the people who are displaced by rising tides and devastating weather changes are climate refugees.

Household Consumption Around the World
A new study quantifies national household consumptions to find which countries are most responsible for climate change based on consumption.

How Continents are Slowing Down Sea Level Rise
The continents of earth are helping slow down sea level rise, a new study shows. Melting glaciers and ice sheets are causing sea levels to change around the world, but the continents are actually absorbing a lot of this excess water.

Bolivia’s Second Largest Lake has Disappeared
Imagery taken in 2013 and again in 2016 shows that Lake Poopó, Bolivia’s second largest lake, has dried up.

The Impacts of Arctic Melt Connecting the Atlantic and Pacific Oceans
Researchers in Global Change Biology explore how Arctic melt, merging the Pacific and Atlantic oceans, impacts animal migration.

Changes in Arctic Environments
Using remote sensing, a team of researchers is studying the fragile arctic environments of Northwest Siberia and how resource extraction and a warming climate affect vegetation, permafrost, and energy budgets.

The Flooding of Chennai: Urban India and Climate Change
In late November and early December, flooding plagued South India and particularly Chennai. AJ Rohn takes a look at the confluence of climate change and urban India.

African Hydropower News
The construction of hydroelectric dams in Sub-Saharan Africa provides the opportunity to bring more power to the region and prepare for rapidly growing populations and offers benefits to health, agriculture, and more
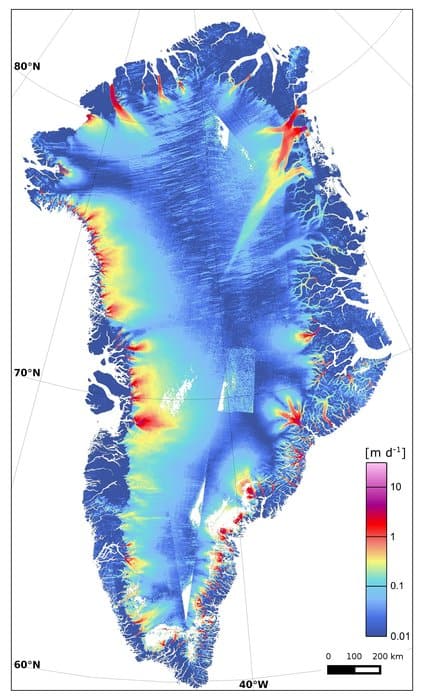
Ice Loss in Greenland
Recent research has shown that one of Greeland’s largest glaciers is losing up to five billion tons of ice every year as it melts into the ocean.

Mapping the Impact of California’s Drought on Its Trees
Remote sensing technologies and satellite images were used to map where the California drought is affecting trees the most.

Map of Carbon Dioxide Levels Over a Year
NASA's Orbiting Carbon Observatory-2 is a major source of information about the life cycle of carbon dioxide on Earth.

Climate Change and Development
Researchers with the London School of Economics and Political Science published a report as part of the Pathways to Resilience in Semi-Arid Economies project that looks into reconciling economic development and poverty alleviation with climate change.

Desert Carbon Sinks
Research suggest that the world’s deserts may be storing some of the climate-changing carbon dioxide emitted by human activities.