
Articles

Getting the Most out of the Esri User Conference
Whether it’s your first time or tenth time attending Esri’s Annual User Conference in San Diego, this annual get together ...

Elevation Map of Tweets
Twitter has release new maps to highlight just how prolific tweets are in London, San Francisco, and Istanbul. Building off ...

Maps for the North Challenged Coming to New York City
New York CIty is installing a network of pedestrian friendly maps in an effort called WalkNYC. The wayfinding maps will be "heads-up" so walker can easily orient themselves to the maps.

Map of Twitter Users by Smartphone
MapBox Labs has mapped out 280 millions tweets from around the world to look at smartphone types. Tweets posted from Smartphone devices were analyzed in order to understand global and local geographic patterns of Android, iPhone, and Blackberry devices.

Map of the Earth’s Vegetation
NASA and NOAA have released a map of the earth's vegetation. The map was created with NDVI data from VIIRS (Visible-Infrared Imager/Radiometer Suite) sensor aboard the Suomi NPP (National Polar-orbiting Partnership) satellite.

Mapping Antarctica’s Bedrock with Bedmap2
The map, called Bedmap2, provides a detailed look at Antarctica from its surface of ice all the way down to the bedrock. The map was compiled by the British Antarctic Survey using data from other research organizations around the globe including NASA

Can Spatial Big Data Build a Better Everyday Life?
Mike Sanderson, the Director of Strategy at 1Spatial, provides a perspective piece on the rise of big spatial data and the importance of being able to base management decisions on correct real-world data.

Near Real-time Bike Share Map
The global bike share map updates every 2-10 minutes with bike inventory data for 85 cities around the world.

Mapping the Salinity of the Ocean
The European Space Agency (ESA) and the National Aeronautics and Space Administration (NASA) are mapping the salinity of the ocean to understand how the ocean helps recycle of our planet’s water resources and our climate.

Computer Specs for GIS Work
Listed here are computer specs to take into consideration when running GIS software in a Windows environment which is required for running ArcGIS.
Open and Machine Readable Now the Default for Government Data
On May 9, 2013, President Barack Obama sign an executive order making the default for government data "open and machine readable". The executive order was accompanied by the White House's Open Data Policy.

Timelapse Satellite Imagery – View Changes on Earth over Time
The series of Landsat satellites has been collecting global imagery continuously since 1972. A total of eight satellites and millions ...

Help Map Historical Weather From Ship Logs
The Old Weather project is a crowdsourcing data gathering endeavor to understand and map historical weather variability.

OpenStreetMap Editor Designed by MapBox Goes Live
iD is a new easy-to-use OpenStreetMap editor that allows anybody with minimal technical knowledge to contribute GIS data to this crowd sourced mapping project.

Create Videos Using Google Street View Hyperlapse
Developed by motion designer Jonas Naimark, Teehan+Lax, a Canada-based technology design agency, released Google Street View Hyperlapse that allows you to create videos of your favorite routes around the world.

Largest Atlas in the World Created using ArcGIS
Earth Platinum, the largest atlas ever printed, was released in February 2012 by Millennium House, Australia. Only 31 copies of the 330 pound, leather-bound book exist and each are priced at $100,000. The atlas was created by the work of 88 cartographer and used ArcGIS.

Atlas of Design
Do you love beautiful maps? The Atlas of Design has been reprinted and is now available for purchase from the North American Cartographic Information Society (NACIS).

Mapping Ecological Change with NEON
With Earth Day nearing, it is an opportune time to highlight a developing project, the National Ecological Observatory Network (NEON). ...

Landsat 8
NASA has continued its long running earth observation data collection with the launch of Landsat 8.

How to Add XY Coordinates to a File in ArcGIS
Outlined in this article are the steps to take in order to add X Y coordinates to a field in the attribute table using Esri's ArcGIS software.

Analyzing Bike Sharing Demand with GIS
To study the best citing of bike stations in New York City for a bike sharing program, the NYC DOT used GIS data and geospatial analysis.
Smartphone Maps Illegal While Driving but Paper Maps are Okay in California
In recent years, some states have been putting harsher laws in place to curb drivers talking on their cellphones or ...
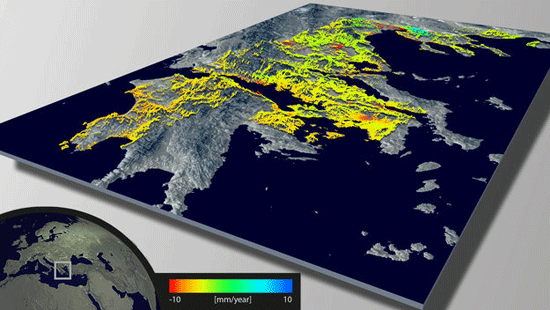
Using Remote Sensing to Measure Land Deformation
The European Space Agency has developed a new land data processor to create maps of land deformation. Called Wide Area Processor ...

Map of Every Photo Taken of the Earth by the International Space Station
The Gateway to Astronaut Photography of Earth houses a collection of over a million archived photos taken by the International ...

Line of Sight in GIS
Line of sight is a GIS analysis that shows the line of visibility from one point across a terrain.

Developing Auditory Maps for the Blind
Human beings navigate through their environment by developing a mental understanding of spatial relationships known as a spatial cognitive maps. ...