
Articles
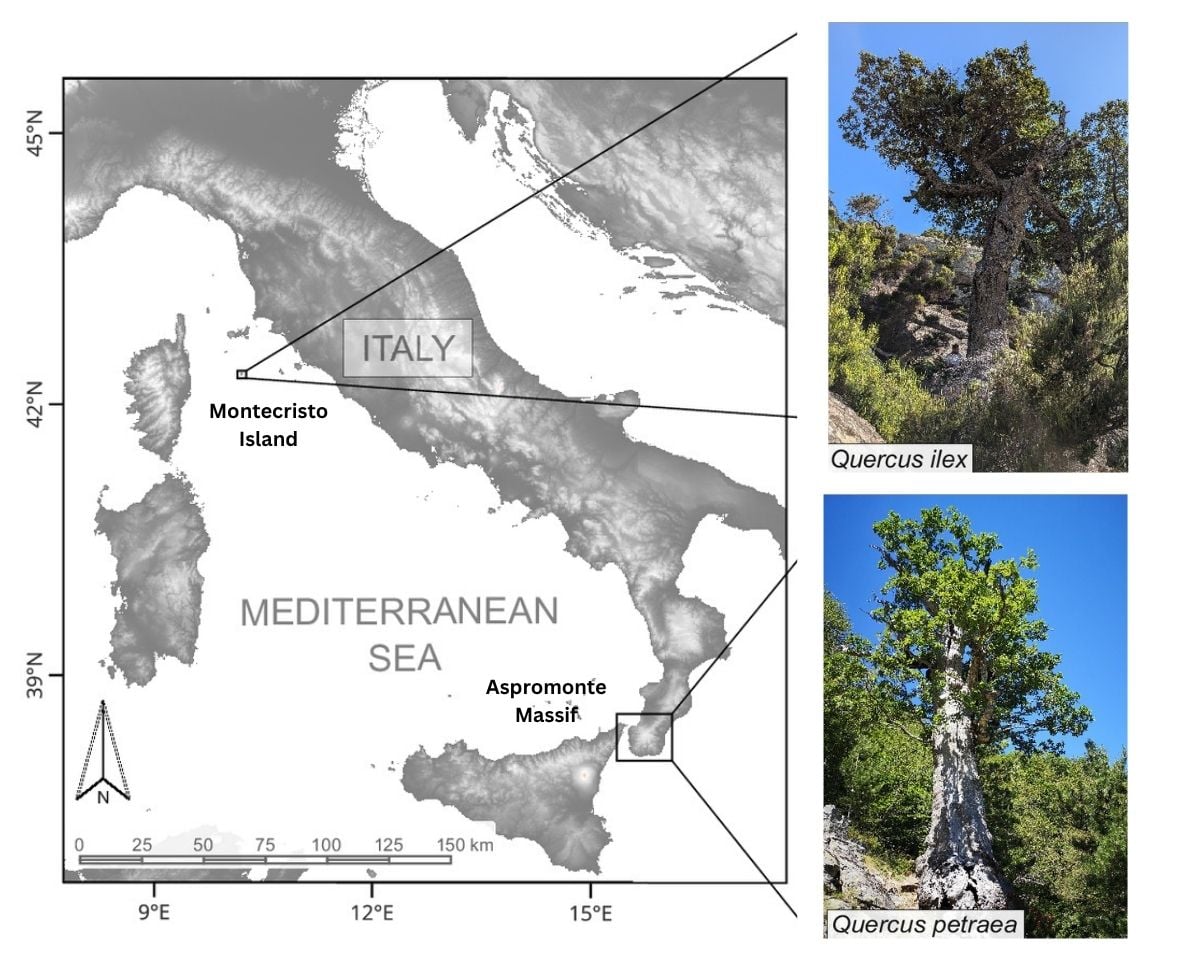
Tracing Medieval Rewilding Through Italy’s Ancient Oaks
A study of ancient oak trees reveals how changes in human land use allowed forests to expand across parts of Italy during the medieval period.
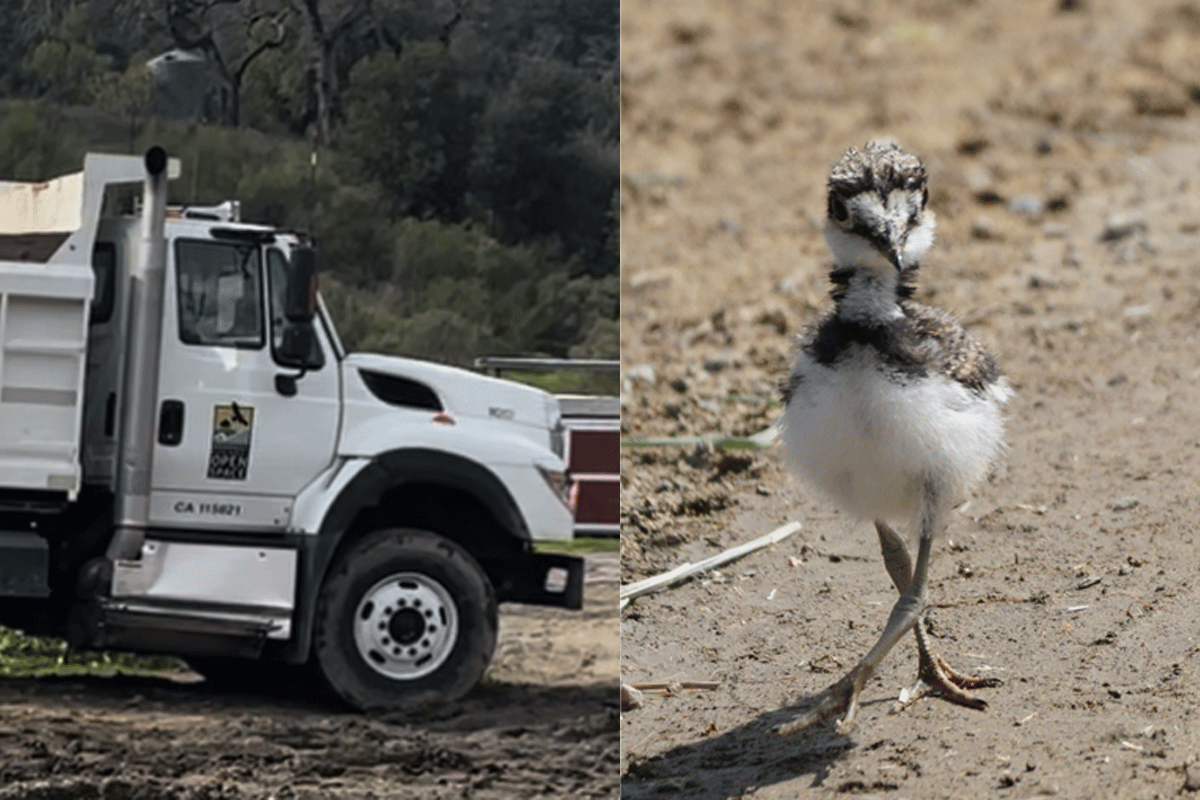
Midpen Open Space and the Harm of Repeat Disturbance
At Bear Creek Redwoods Open Space Preserve, repeated nesting season projects by Midpeninsula Regional Open Space District are altering habitat used by migratory birds.
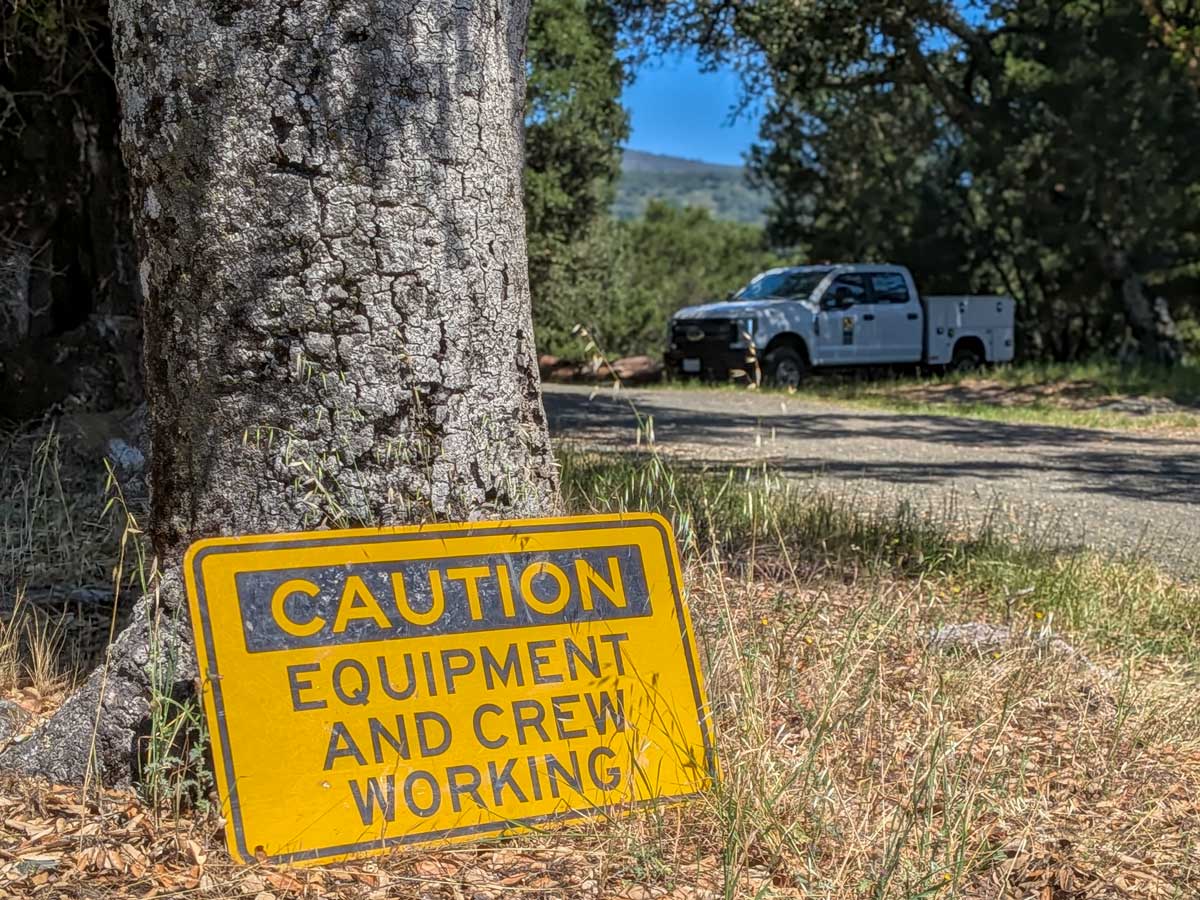
Timing Matters: Spring Mowing, Nesting Birds, and Native Wildflowers at Bear Creek Redwoods Preserve
Midpen says timing matters in grassland management. At Bear Creek Redwoods, spring mowing conflicts with ground nesting birds and blooming wildflowers.

Florida’s Primary Reef-Building Corals are ‘Functionally Extinct’
A 2023 heatwave killed nearly all of Florida’s main reef-building corals, leaving the reef functionally extinct.

Using Landsat and NDVI to Map Vegetation Change
Landsat imagery and NDVI are used to monitor vegetation change, from invasive grass spread in rangelands to early stress detection in coastal marshes.
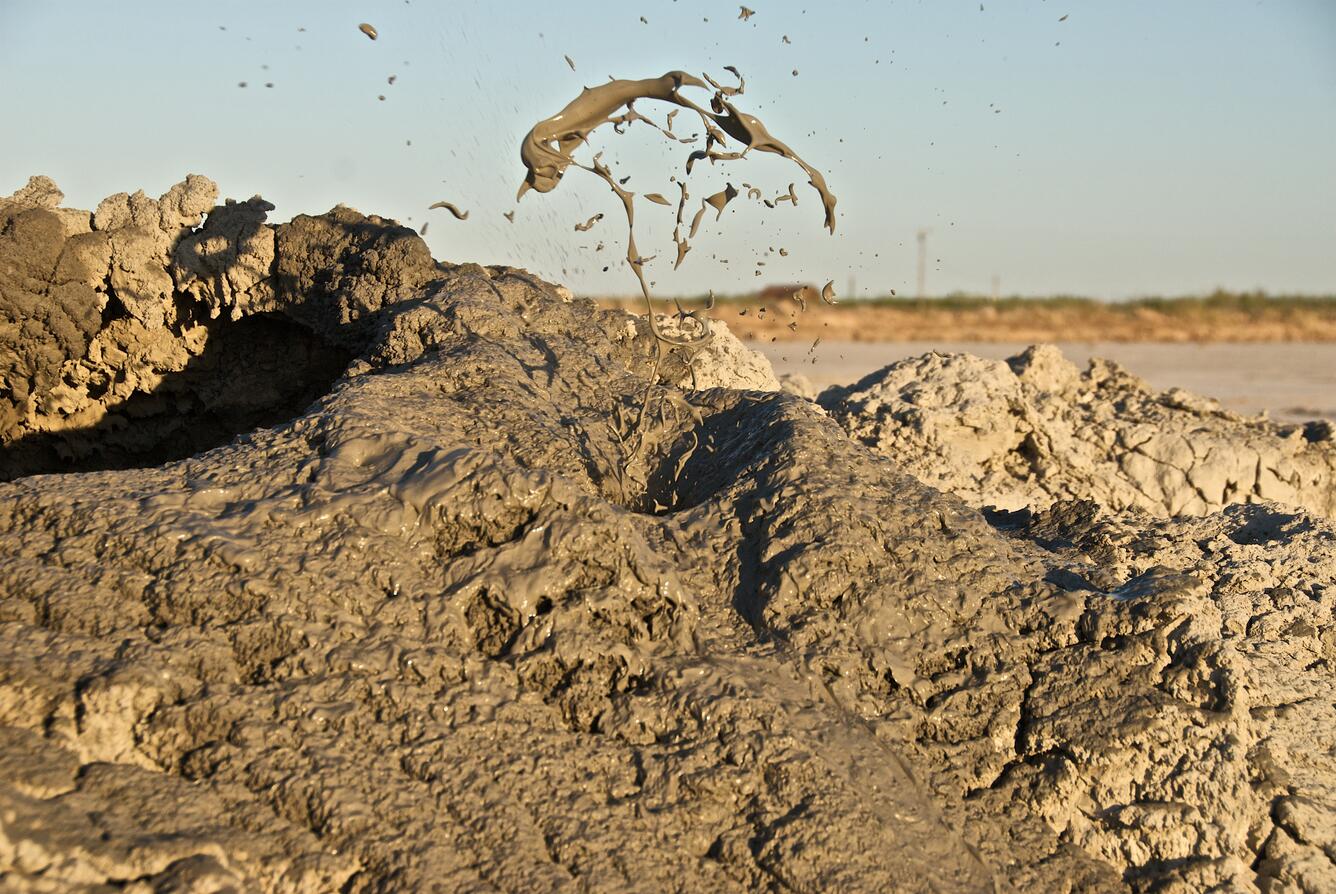
GIS Data: Shallow Sea Mud Volcanoes
A global dataset of 700 mud volcanoes was recently published by geologists from Sapienza University.
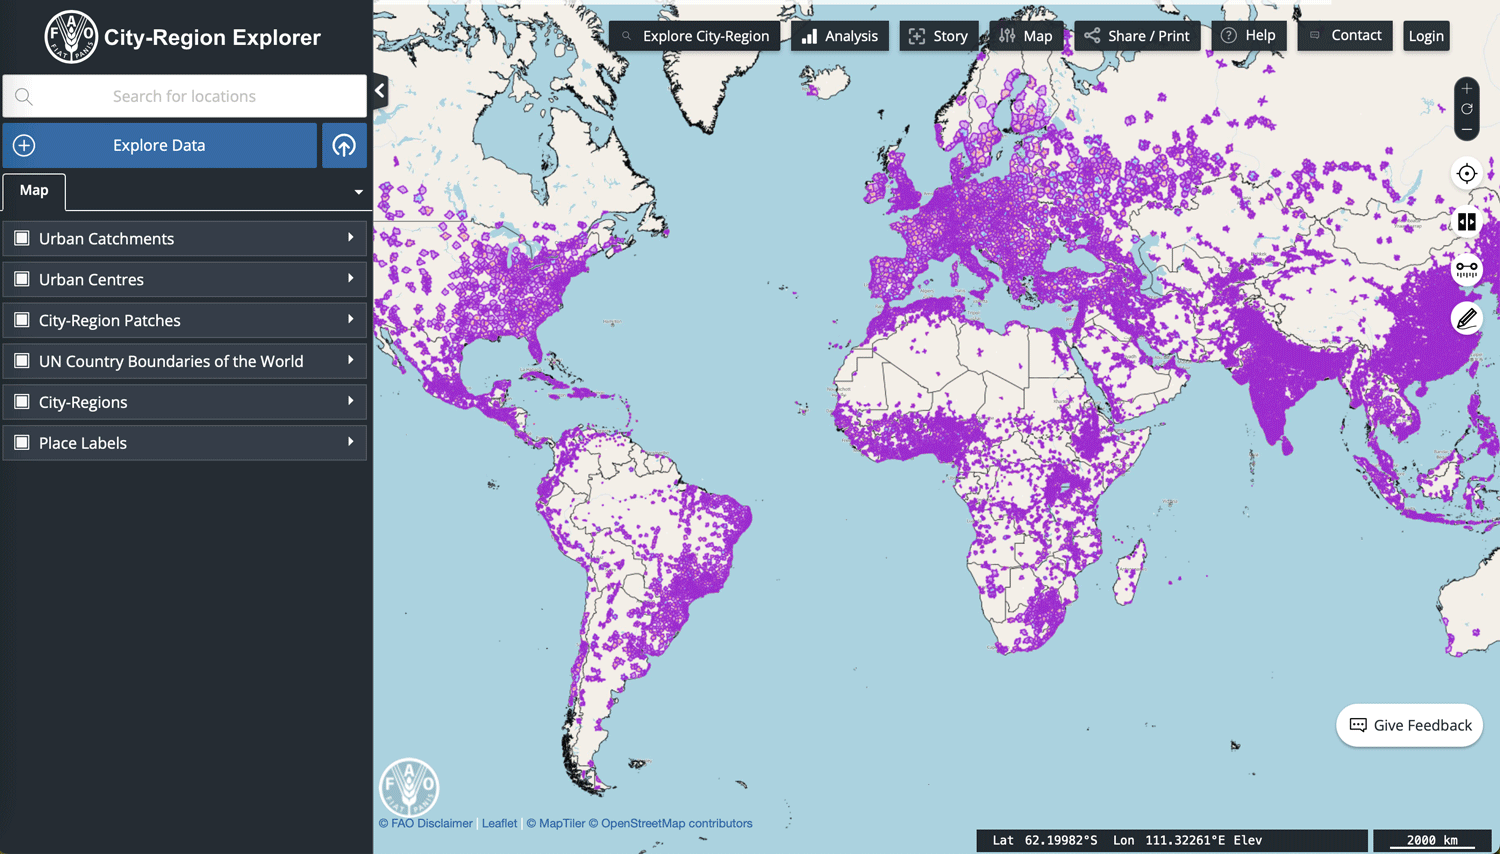
Explore the City-Regions Dataset from FAO
FAO’s global dataset maps access to towns and cities of all sizes within reasonable travel times, identifying patterns of urban interconnectedness.
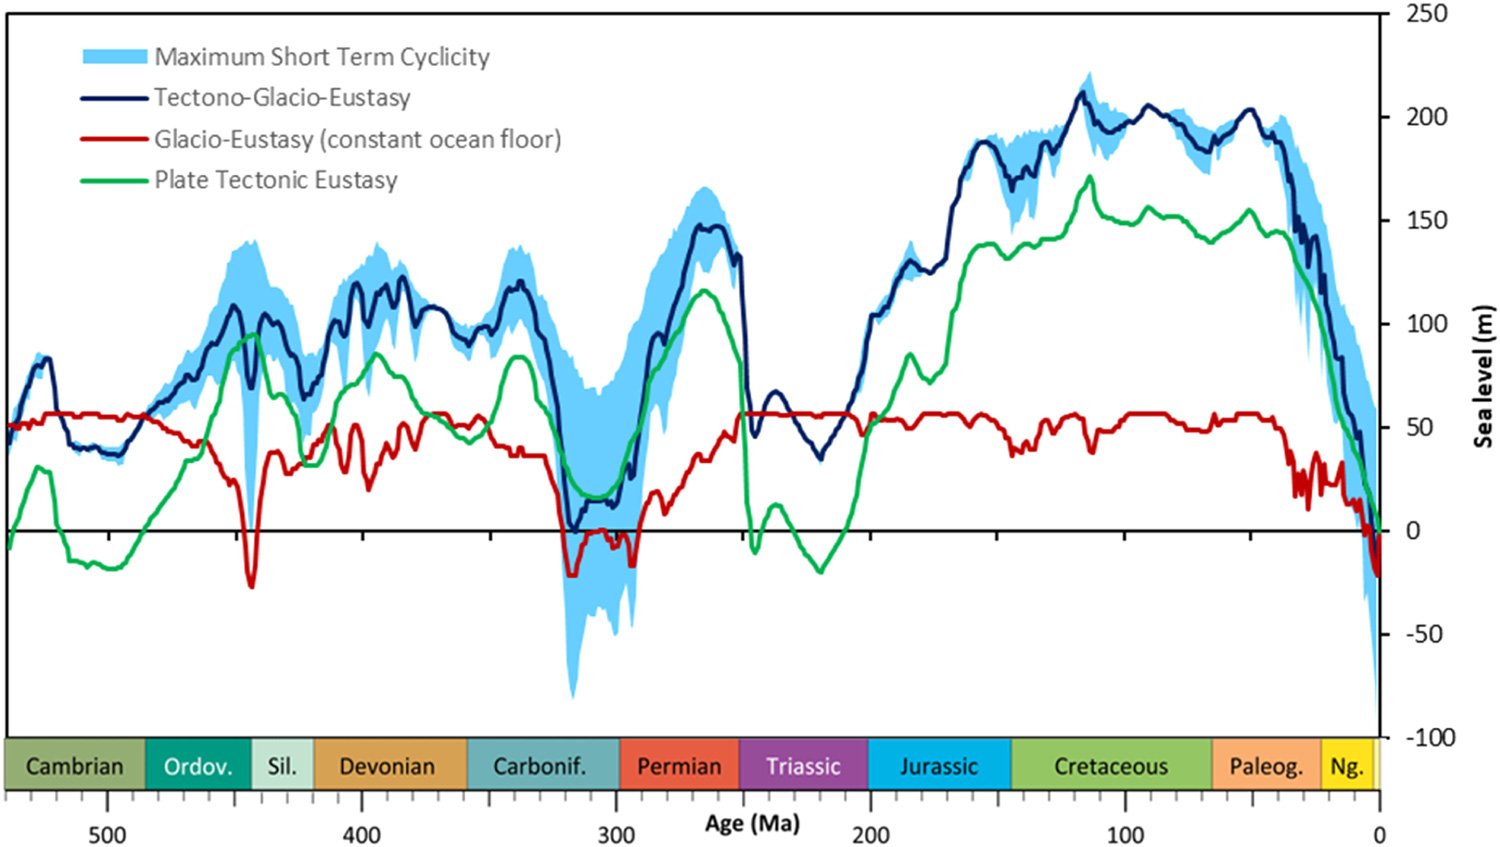
Mapping Short-term Sea Level Changes Over 540 Million Years
Researchers mapped 540 million years of sea level change, showing major short-term shifts during ice ages driven by Earth's orbital cycles.

Water Can Take Years to Seep out of Mountains
Groundwater stored over many years is a significant contributor to streamflow in Western United States mountains according to a published study.
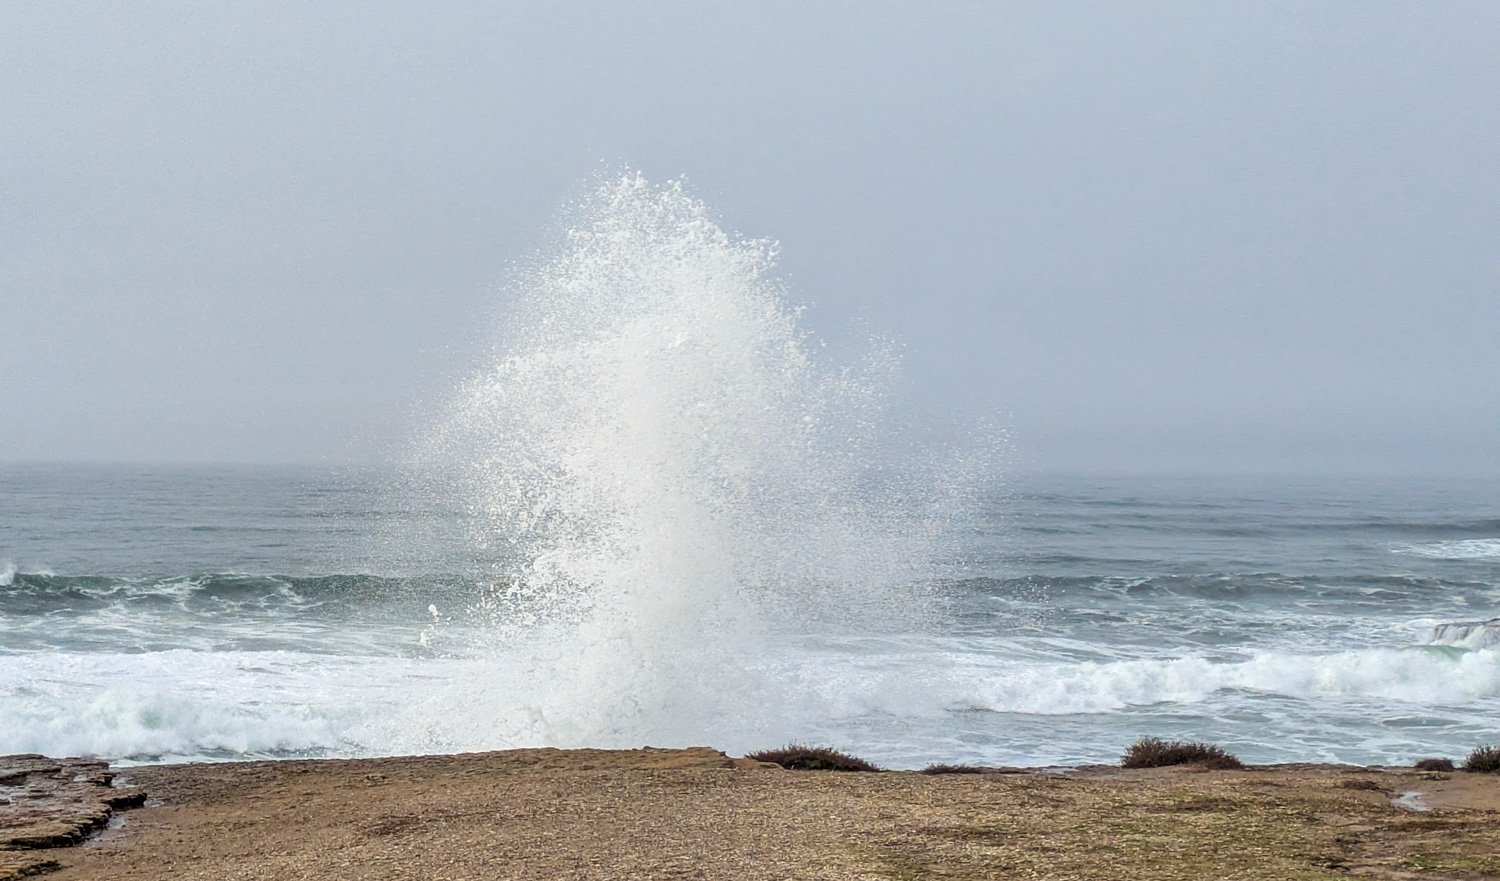
Study Models How the Behavior of Waves Affects Blue Carbon Storage
Bubbles created by the movement of waves can influence how much carbon dioxide is absorbed by the ocean.
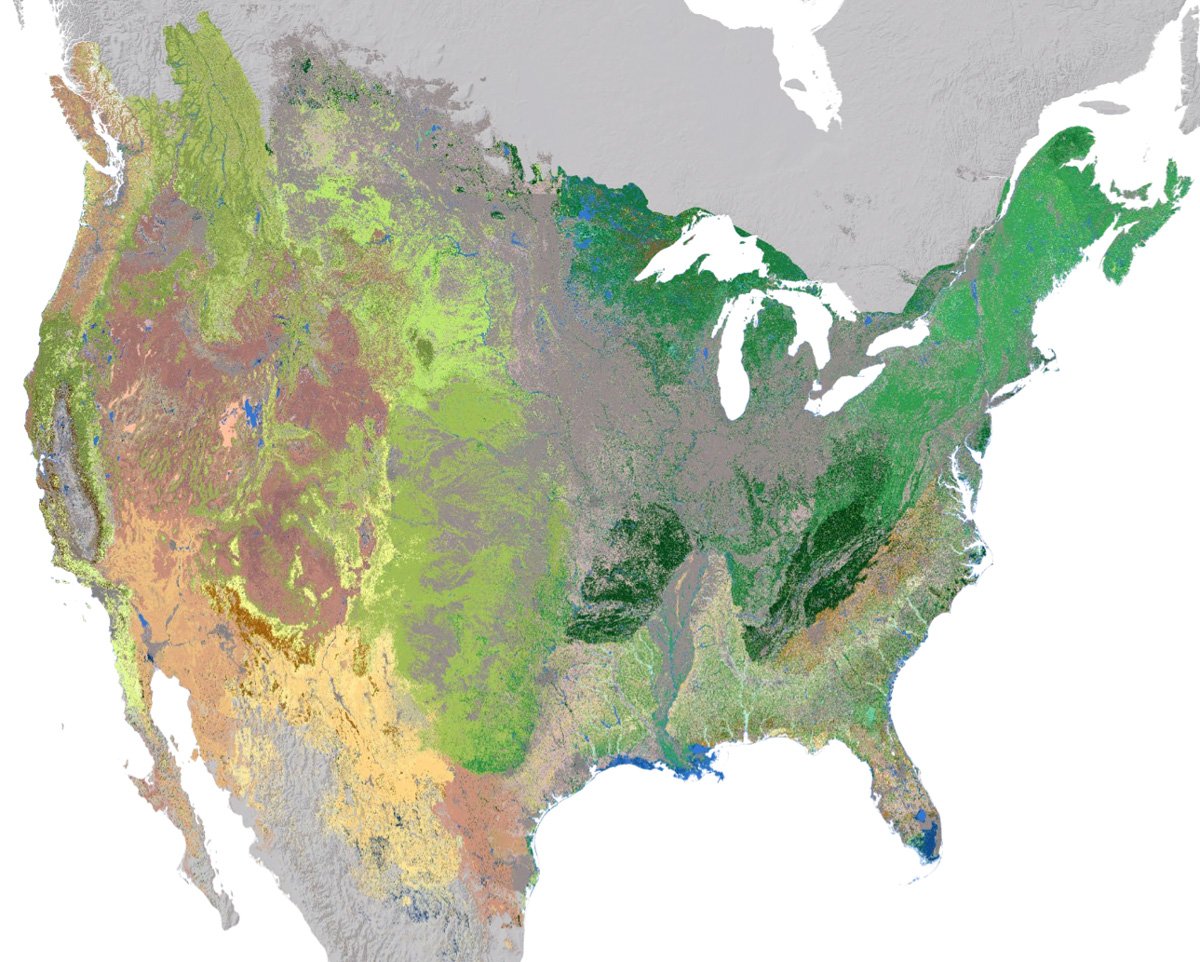
High Resolution Ecosystem Map of the Contiguous United States and Adjacent Areas
NatureServe has developed an updated 30-meter hexagon map of regional ecosystems in the contiguous United States and adjacent areas.
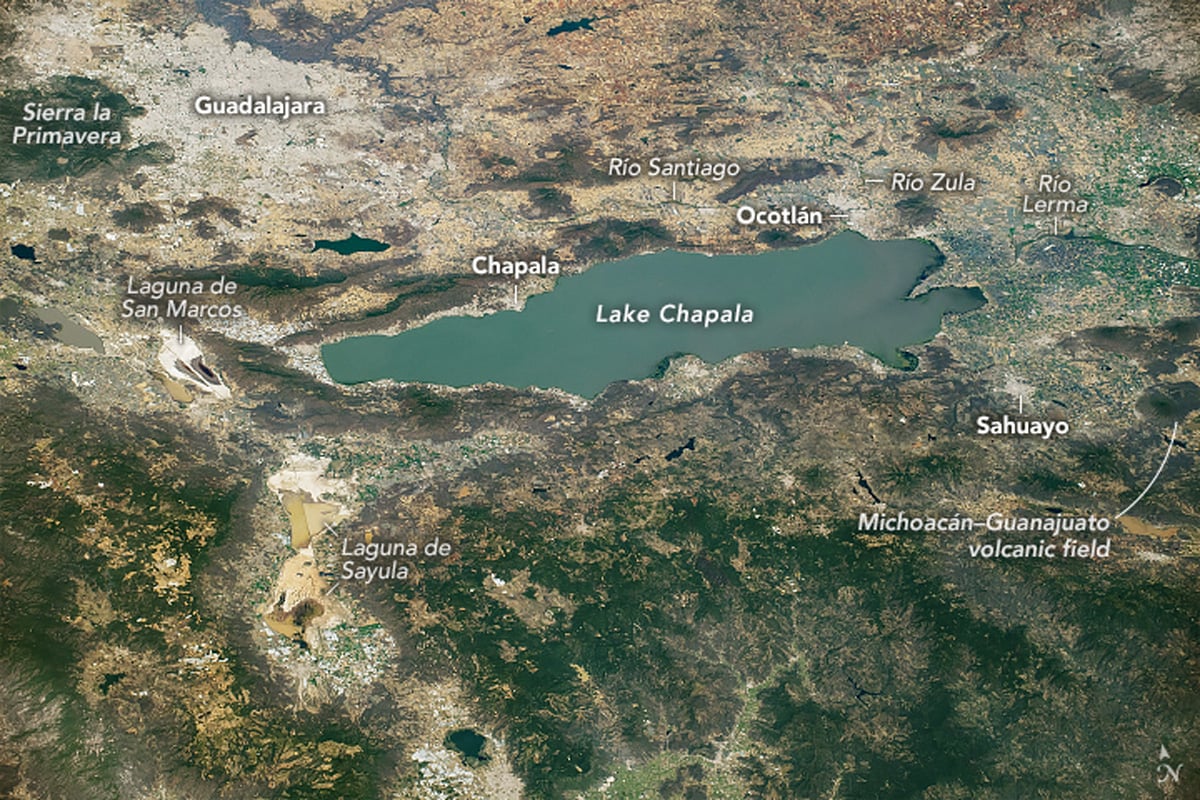
Lake Chapala: a Tectonic Lake at Mexico’s Triple-graben Intersection
Lake Chapala was formed at the intersection of three grabens.

Rivers that Flow Backwards
Read about how the Amazon once flowed east to west and how the strength of Hurricane Isaac once change the course of the Mississippi river.

Northernmost Point in the United States
Above the Arctic Circle, Point Barrow is the northernmost point in the United States.

How to Create a Radial Flow Map Using QGIS
Learn how to create a radial flow map in QGIS to visualize migration using metro-to-metro data from the U.S. Census Bureau.

Map and Chart of Cardinals and the 2025 Papal Conclave
The 2025 papal conclave is underway. Here's which countries the 135 voting cardinals eligible to elect the next pope come from.

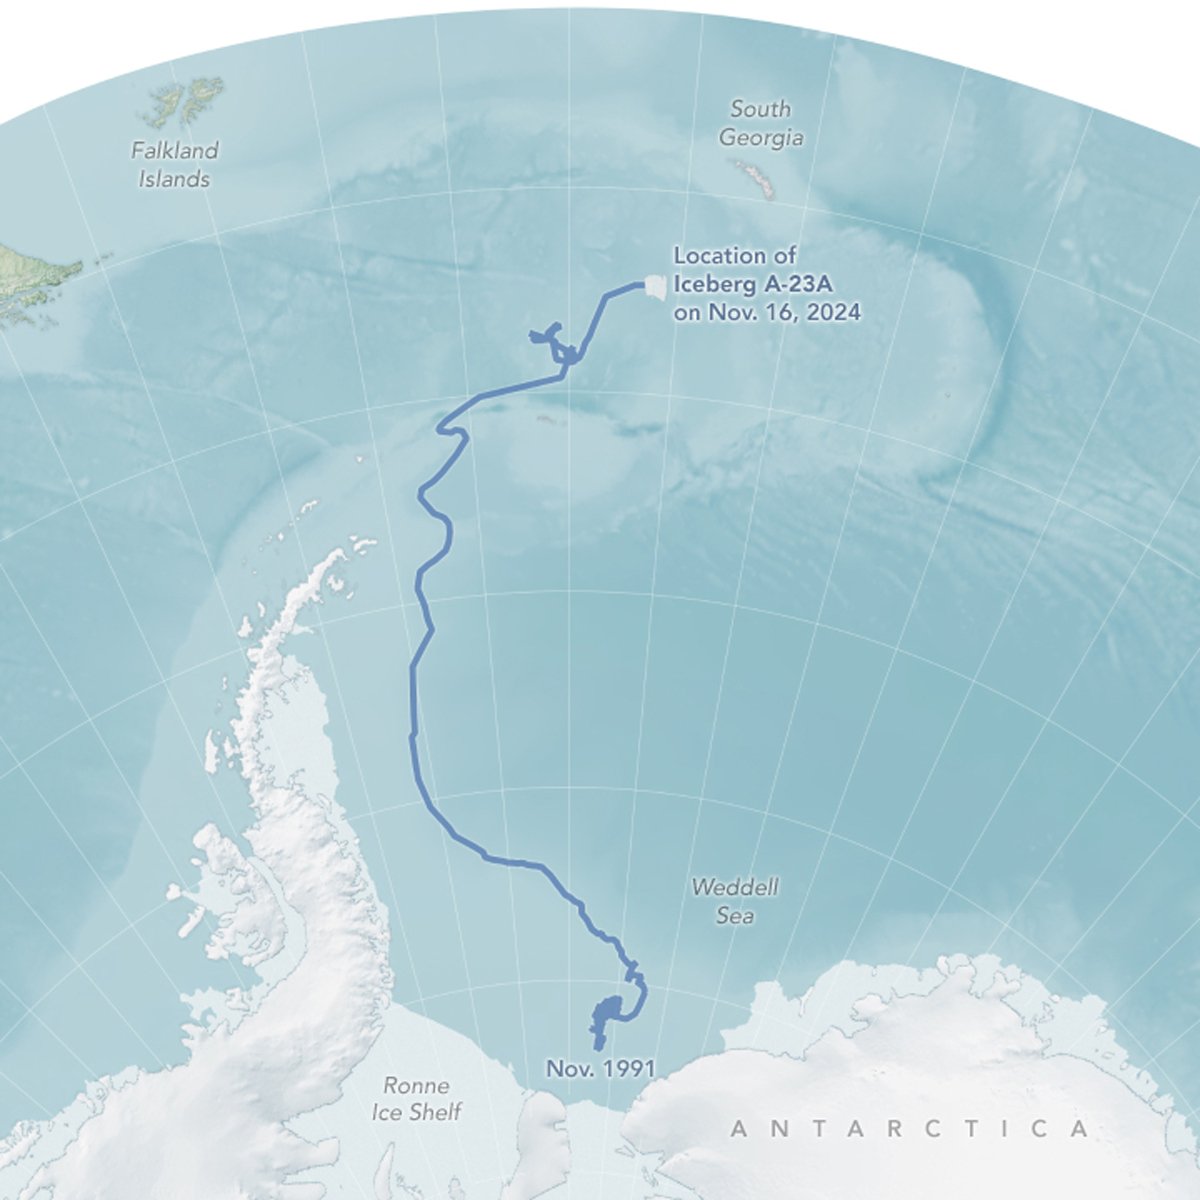
World’s Biggest Iceberg
The largest iceberg in the world is A-23A, with an area of about 1,240 square miles.
Geography and GIS Glossary
This Geography and GIS glossary provides definitions for terms related to geographic information systems (GIS), cartography, remote sensing, and other ...

Only State… Geography Facts
Here are some interesting geography facts that are unique to individual U.S. states and do not occur in any other state.

Satellite Imagery of Clouds
Listed here are different clouds formations as seen on satellite imagery.

Water on Earth
Earth holds trillions of tons of water, mostly in oceans. Only 2.5% is freshwater, primarily found in glaciers, groundwater, lakes, and rivers.

Where are GIS Professors Hired From?
Researchers analyzed GIS faculty hiring data to identify geographic patterns influencing job placement.

Types of Agricultural Patterns Visible from Space
Agricultural landscapes, when viewed from space, reveal distinct patterns shaped by historical practices, local geography, and technological influences.

Defining How Much of the World is Covered by Forests
With no universal definition, mapping and comparing forest coverage around the world is challenging.

Glacial Flour Makes Some Lakes Turquoise
Glacial flour, the fine dust created as glaciers move over land, turns lakes a turquoise color by reflecting blue and green light.

Geography Printables
GeographyFun features maps, crosswords, and word searches for educators, students, and geography enthusiasts who love exploring the world through words.