
Articles

Deep Space Mapping of Saharan Dust Height
Researchers used four years of measurements from a deep space satellite to calculate the average monthly heights of Saharan dust clouds.

Hydroclimate Whiplash: the Impact on California Wildfires
Rapid shifts between extremely dry and unusually wet conditions are reshaping California’s fire landscape by increasing vegetation growth, drying fuels, and contributing to more intense wildfires.

Florida’s Largest Open Water Estuary
Covering an area of about 400 square miles, Tampa Bay is Florida's largest open water estuary.

Cartopareidolia: Seeing People and Animals in Maps
Cartopareidolia is the tendency to see familiar shapes, animals, faces, and objects in coastlines, borders, and maps.

Shapefile Viewers
Explore viewers for visualizing GIS vector data in shapefile format, available for both desktop and web browsers.

Sado Island: An Example of Tripartite Geography
Sado Island is an example of a landmass with tripartite physical geography.

Understanding Glacier Grounding Lines
Grounding lines are the boundaries where glaciers and ice sheets transition from resting on solid ground to floating on seawater.
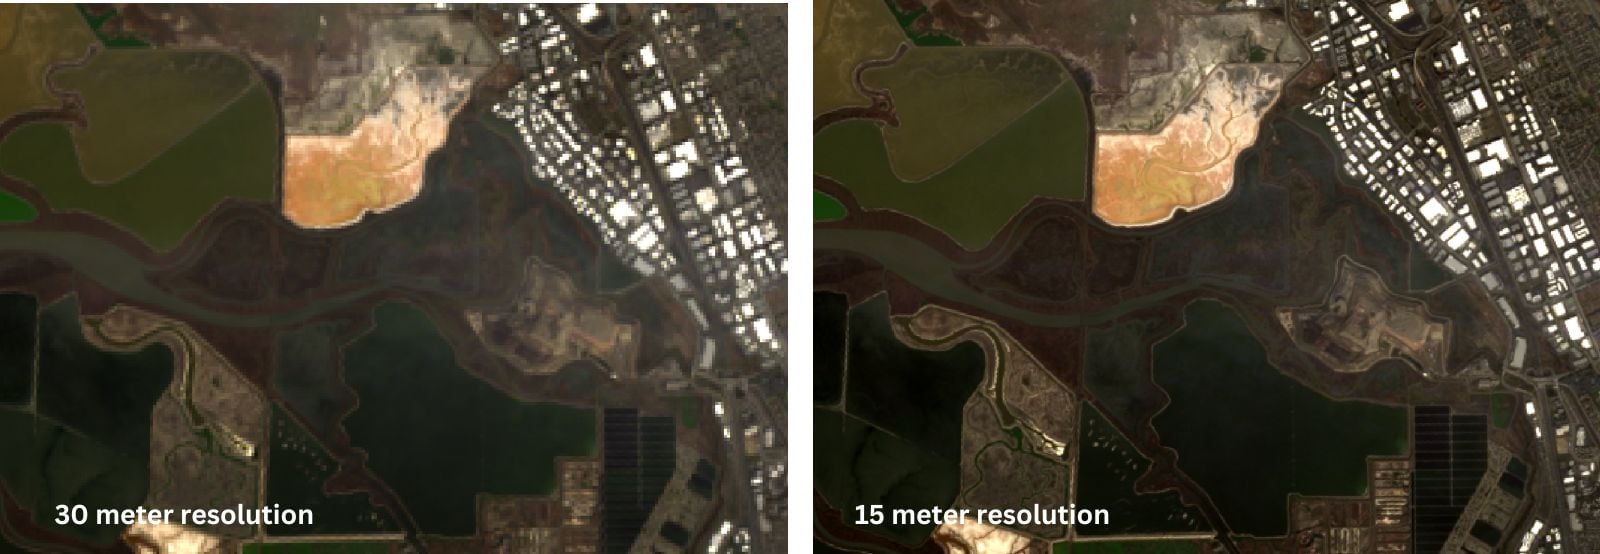
Pan Sharpen Landsat Imagery in QGIS
This QGIS tutorial guides you through pan sharpening Landsat imagery by combining the 15-meter panchromatic band with lower-resolution multispectral bands.

Pan Sharpening in GIS
Enhance spatial detail in multispectral images with pan sharpening. Learn how this GIS technique combines data for sharper, more detailed satellite imagery.

Isostatic Rebound: How Earth’s Surface Rises after Glaciers Retreat
Isostatic rebound is the Earth's slow rise after glaciers melt, reshaping coastlines, revealing landforms, and altering sea levels globally.

Cavum: Hole-punch Clouds
Cavums are also known as hole-punch clouds or fallstreak holes.

Mapping Methane: the Launch of MethaneSAT and the Limitations of Satellite Data
While advances in remote sensing and satellite technology have improved methane mapping, ground measurements remain essential for accurate, localized data.

Increased Light Pollution in the Arctic
Satellite data reveals growing nighttime light levels across the Arctic, linked to expanding oil, gas, shipping, and infrastructure activity.

The Rise of Proglacial Lakes
Glacial retreat in Alaska's Yakutat Foreland has fueled rapid growth of proglacial lakes, doubling their size in 40 years as seen in Landsat imagery.

Overview Effect: Quotes from Astronauts After Seeing the Earth from Space
The Overview Effect is a shift in awareness by astronauts seeing Earth from outer space as a “tiny, fragile ball of life.”

Extratropical Cyclones in the United States
Extratropical cyclones are powerful storms forming between 30°–60° latitude, driven by temperature contrasts.

Land Carbon Storage Declined Sharply in 2023
Global land carbon storage saw a significant decline in 2023, driven by extreme droughts, wildfires, and heatwaves.

Storms in the Western Pacific Ocean
The western Pacific experienced a rare event in November 2024 with four simultaneous storms.

Planting Trees in the Arctic May Contribute to Climate Change
Afforestation in Arctic regions may accelerate permafrost thaw, releasing stored carbon and potentially exacerbating climate change.

Desert Dust Triggers Photoplankton Blooms in the Ocean
Saharan dust carries vital nutrients across oceans, triggering phytoplankton blooms that boost marine productivity and influence global carbon cycles.

Largest Piedmont Glacier in North America
Southeastern Alaska is home to North America’s largest piedmont glacier, where mountain ice spreads outward across a broad coastal plain.

Pushing the Boundaries of Geospatial: New Books from Esri Press
Three recent publications from Esri Press: Mapping the Deep, The Geography of Hope, and The Power of Where.

Lenticular Clouds
Lenticular clouds are lens-shaped formations that form over mountains when moist air cools and condenses, creating smooth, often UFO-like cloud patterns.

Understanding the Increase in PyroCbs: Wildfire Thunderstorms
Wildfire-driven thunderstorms, known as pyroCbs (pyrocumulonimbus clouds), are becoming more frequent.

Automating a London Tube Style Transit Map of the World
Using OpenStreetMap data, researchers created an automated world transit map with simplified layouts modeled after the London Tube map design.

Study: Cities at Higher Latitudes Benefit More from Urban Vegetation Cooling
Study in Nature Communications examined cooling benefits of urban vegetation in 468 cities to see where parks and greenery benefit residents most.