
Articles
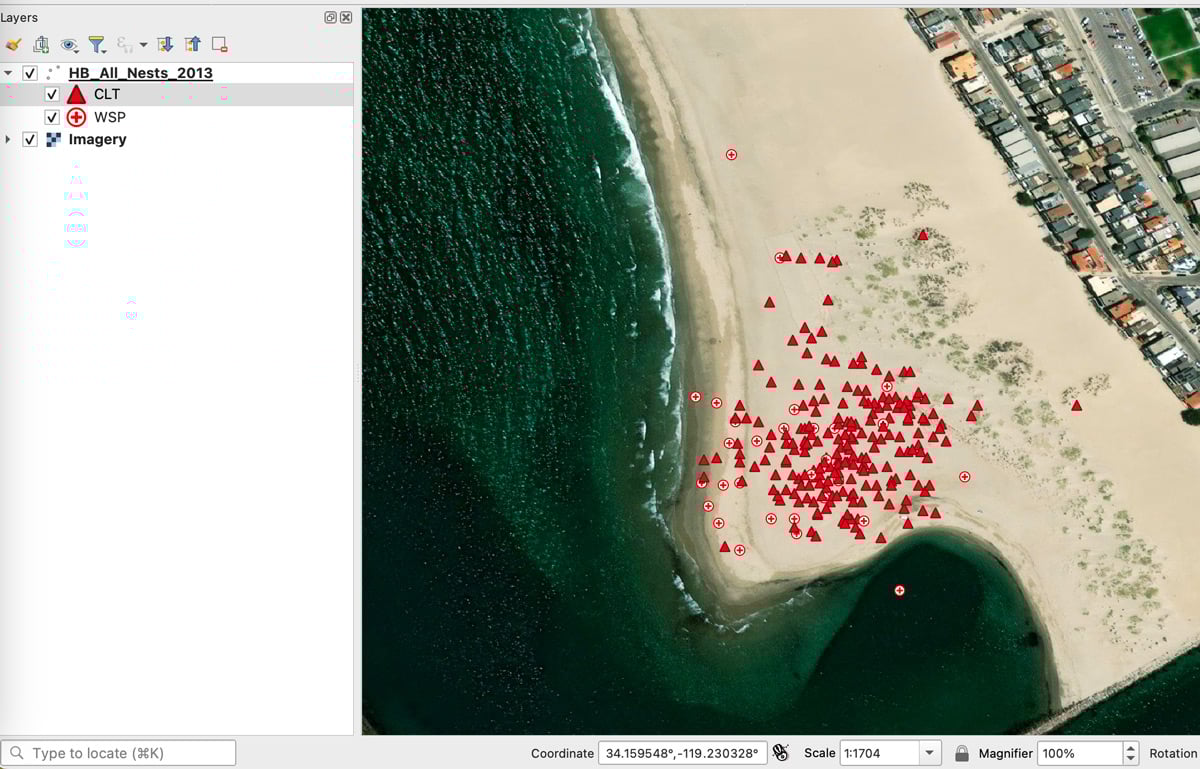
How to Find the URL to an ArcGIS Online Web Map and Add it to QGIS
Learn how to find URLs for older feature and map servers hosted on ArcGIS Online so they can be added to QGIS.

Chorology and Chorography
Chorology examines places and regions, often known as regional geography, while chorography focuses on describing or mapping those regions.

How to Use Esri File Geodatabases in QGIS
Learn how to load both Esri vector and raster file geodatabases in QGIS.

Little Known QGIS Parlor Tricks
The coordinate box in QGIS is one place where you can uncover neat little GIS mapping tricks.
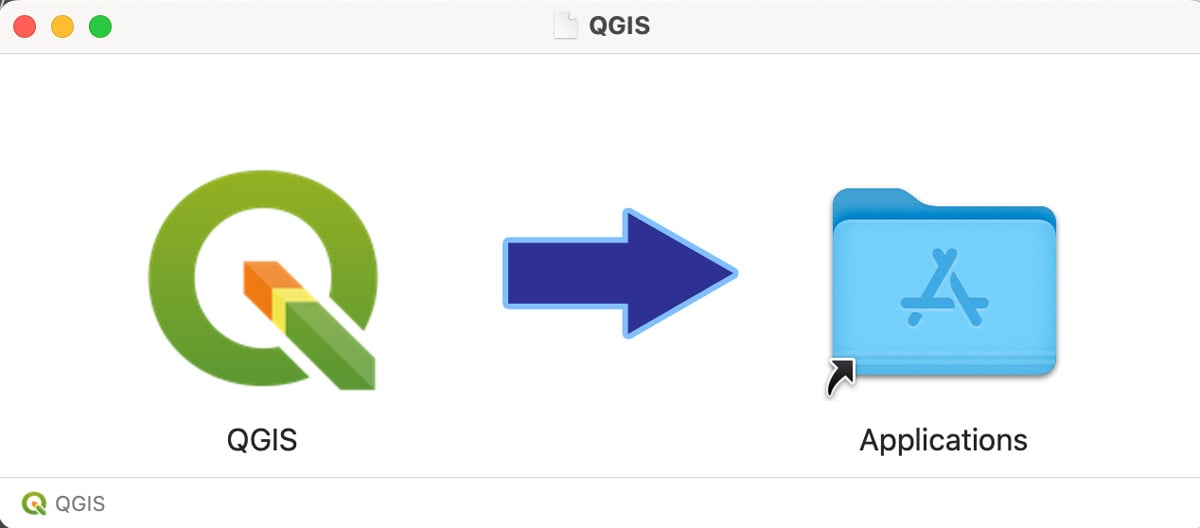
How to Install QGIS on a Mac Computer
Follow these step-by-step instructions on how to install QGIS on a Mac.

What to Know About Absolute and Relative Location
Understand absolute and relative location: absolute uses coordinates or fixed points, while relative describes a place in relation to another location.

Witness Posts
Witness posts are signs that alert visitors to the presence of a nearby survey marker.

Witch’s Broom in Trees: Dense Clump of Leaves and Branches
Witch's broom affects trees like birch, spruce, and pine, causing dense twig and leaf clusters due to pathogens, parasites, and environmental stressors.

Using Satellite Data to Map Extreme Heat
As heatwaves grow more frequent and severe, scientists use remote sensing and Earth system models to monitor and forecast extreme heat.

Venezuela Becomes the First Country to Lose its Glaciers
Venezuela became the first country to lose all of its glaciers as the last remaining ice on Pico Humboldt shrank to less than two hectares.

Understanding Fast Ice in Polar Ecosystems and Climate Dynamics
Fast ice, found in both polar regions, is sea ice that attaches to coasts, icebergs, ice shelves, or the ocean floor.

Mapping Coral Reef Health with Sound
Scientists used artificial intelligence and passive acoustic monitoring to assess coral reef health by analyzing the sounds of the ocean.

A Guide to the Geography of U.S. National Parks
Find out the answers to geography trivia questions and more in this article about the geography of U.S. National Parks.

Explore U.S. National Parks: Fun Map and Geography Trivia
This interactive map lets you browse interesting geographical facts and trivia about the 61 U.S. national parks.

What’s in a Map? Exploring the Elements of Cartography
Maps visualize geographic data, and contain elements like data frames, legends, titles, north arrows, scale bars, citations, borders, and inset maps.

Nunataks: Glacial Islands
Nunataks are isolated mountain peaks visible above ice sheets in polar and high-altitude regions.

Study Models How Well Marine Protected Areas Overlap Fish Habitat
A study found that most marine protected areas (MPAs) don't adequately cover key habitats of diadromous fish with only 50% of core habitats protected.

Understanding the Earth’s Structure: A Guide to Tectonic Plates
The Earth's lithosphere is divided into tectonic plates, which are in constant motion. Learn where to find GIS data on tectonic plates.

Using GIS to Design Child-Friendly Cities
Using GIS, cities can design child-friendly pedestrian pathways that prioritize children's interests and safety, promoting urban living and sustainability.

What is an Ice Arch?
An ice arch forms when sea ice buckles under pressure, creating a natural arch-shaped structure in polar regions, often blocking the movement of ice.

Polynyas: Natural Openings in Polar Ice
Explore the geography of polynyas, unique open water areas in polar ice, and learn about their formation, ecological impact, and role in climate dynamics.

What is at Zero Degrees Latitude and Zero Degrees Longitude?
What can be found at zero degrees latitude and zero degrees longitude?

Urban Tree Canopy Affects How Heat Stress Impacts Residents
Minority and low-income neighborhoods have 11% fewer trees, are 1.5°C hotter, and have 14% more impervious surfaces than wealthier, whiter areas.

Types of GIS Data Explored: Vector and Raster
Explore the key differences between GIS vector and raster data, and how each type supports diverse spatial analysis tasks.

Building a GIS Career
Geospatial technology is widely used across industries, with evolving GIS skills. Here are tips to prepare for a GIS career.

Acequias in the Southwest U.S.
In New Mexico and other Southwestern states, acequias are channels that are dug to divert water from snow runoff and rivers in order to irrigate fields.