
Articles

Latitude and Longitude Explained: How to Read Geographic Coordinates
Learn more about lines you see on a map running east-west and north-south called latitude and longitude.

Finding Penguin Colonies from Space
Satellite observations help researchers track penguin populations in some of the most remote regions of Antarctica.

When Rivers Become Ice Roads
During the cold winter months, parts of Canada's Mackenzie River become a ice road that trucks up to 22,000 pounds can navigate.

Will Cool Air Pooling Protect Some Forests from Climate Change?
Researchers looked at the link between cool air pooling and cold-adapted forest composition.

5 Ways GIS Users Can Broaden Their Geospatial Skills
From programming and remote sensing to volunteering and networking, there are many ways to build new geospatial skills.

Forecasting Phytoclimates
A study of 135,153 vascular plant species predicts that by 2070, 33-68% of land on Earth will experience significant phytoclimate changes.

The World’s Smallest Mountain Range
Surrounded by flat farmland, the Sutter Buttes are an isolated volcanic landform often described as the world's smallest mountain range.

Human-Driven Extinction of Birds
Researchers using models and historical records estimate that up to 11% of all bird species have gone extinct since the Late Pleistocene.
Learning GIS Programming
Having some competence in programming has become a critical requirement for many geospatial positions. So which languages should you learn for GIS programming?

This Bird is Not the Only Crested Jay West of the Rocky Mountains
Since the 1960s, blue jays have steadily expanded their range beyond the Rocky Mountains into western North America.

Choosing the Right Satellite Bands for Remote Sensing
Learn how different satellite sensors respond to Earth's features and which spectral bands are best for remote sensing.

Adapting Time Series Data for Earth Observation
UniTS is a tool designed to simplify the process of using multiple time series datasets created over different time periods and for different geographic resolutions.

Weather Forecasting Using Artificial Intelligence
GraphCast is a Google DeepMind effort that uses deep learning to improve medium-range weather forecasting.

Relief Inversion
Telling the difference between a canyon and a mountain on aerial or satellite imagery can sometimes be tricky due to an optical illusion known as relief inversion.

Measuring Tree Height with a Pair of Satellites
Using synthetic aperture radar (SAR) data from two satellites, researchers developed a method for estimating tree canopy height.

Using Animals to Collect Weather Data
Attaching sensors to wildlife could give scientists fine-scale weather data from the habitats animals move through.

How Sea Level Rise Will Affect Salt Marshes
Researchers have calculated that about 90 percent of salt marshes are under threat from rising sea levels predicted to occur by the year 2100.

Collecting GIS Data in the Field Using QGIS and QField
This QGIS tutorial takes you through the steps to synchronize a map project with QField in order to collect GIS data using a mobile device.

American Chestnut: the Struggle to Save the ‘Redwood of the East’
Scientists and conservationists are working to rescue the American Chestnut from going completely extinct.

Surge Flows: A Rare River Phenomenon
Surge flows are a rare phenomenon where shallow waters, sand or sediment, and steep topography combine to create waves in rivers.

Conservation Tech: Monitoring Humpback Whales Using Image Recognition
Happywhale is a citizen science effort that uses AI to identify and track humpback whales.
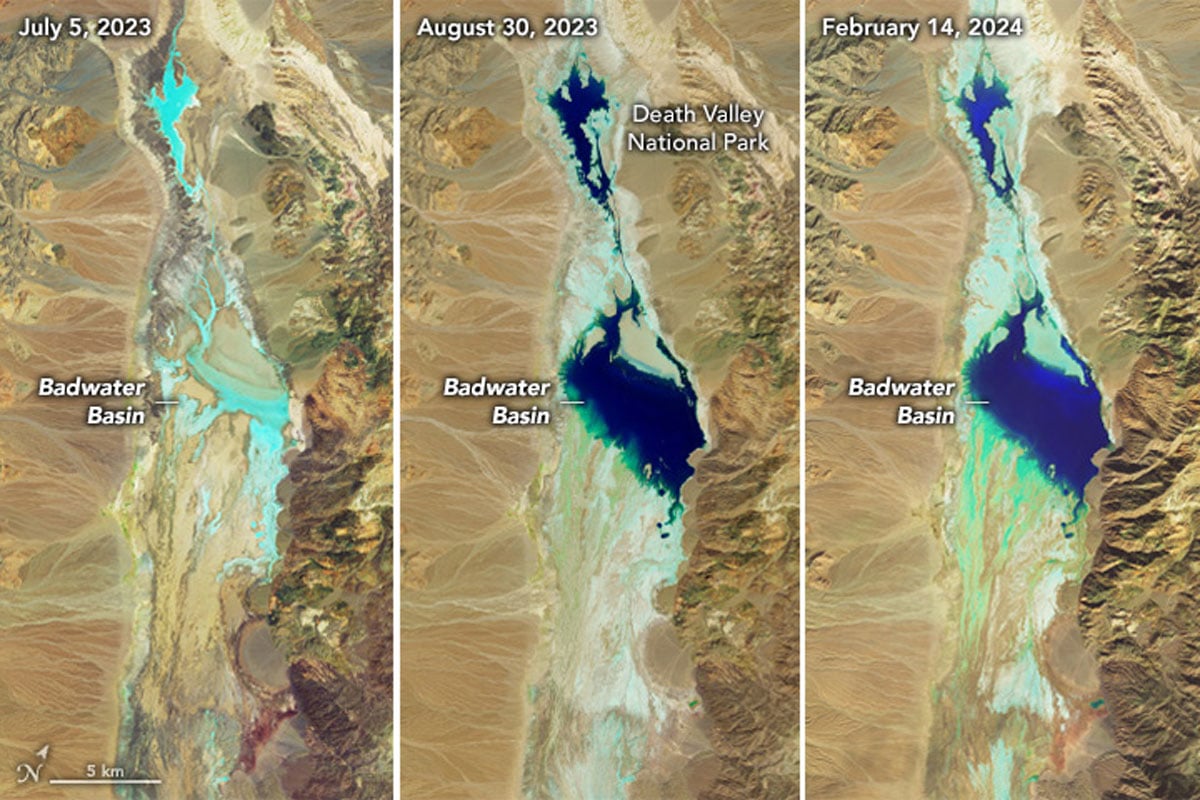
North America’s Lowest Point on Land is Currently a Lake
Two recent heavy rainfall events have filled Badwater Basin, the lowest point in North America on land, up with water.
Using QGIS to Create a Hexbin Map
It is fairly easy to create a hexbin map using QGIS by following this GIS tutorial.

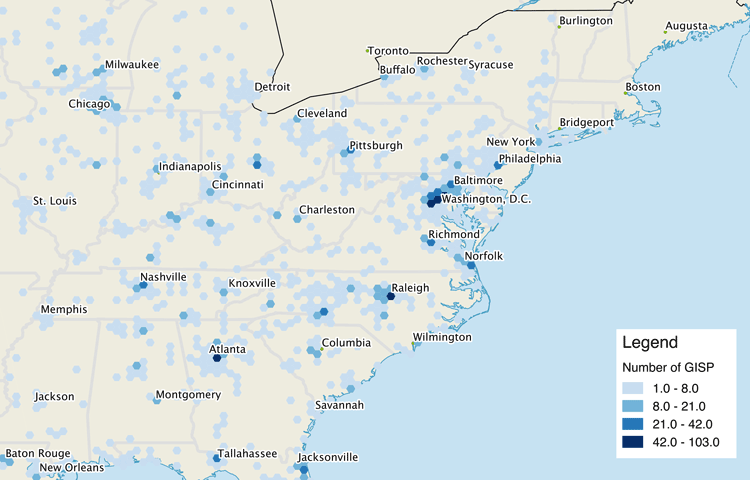
Geography of Lightning Strikes in the United States
Researchers recently mapped out data from the U.S. National Lightning Detection Network (NLDN) between 2017 and 2022 to see where lightning strikes the most across the contiguous United States.

Overwintering Monarch Butterfly Populations
The latest counts of overwintering monarch butterflies in California and Mexico.

Before There was GPS: Personal Navigation in the Early 20th Century
Here are a few creative ways inventors tried to make driving directions easier before there was GPS.