
Articles
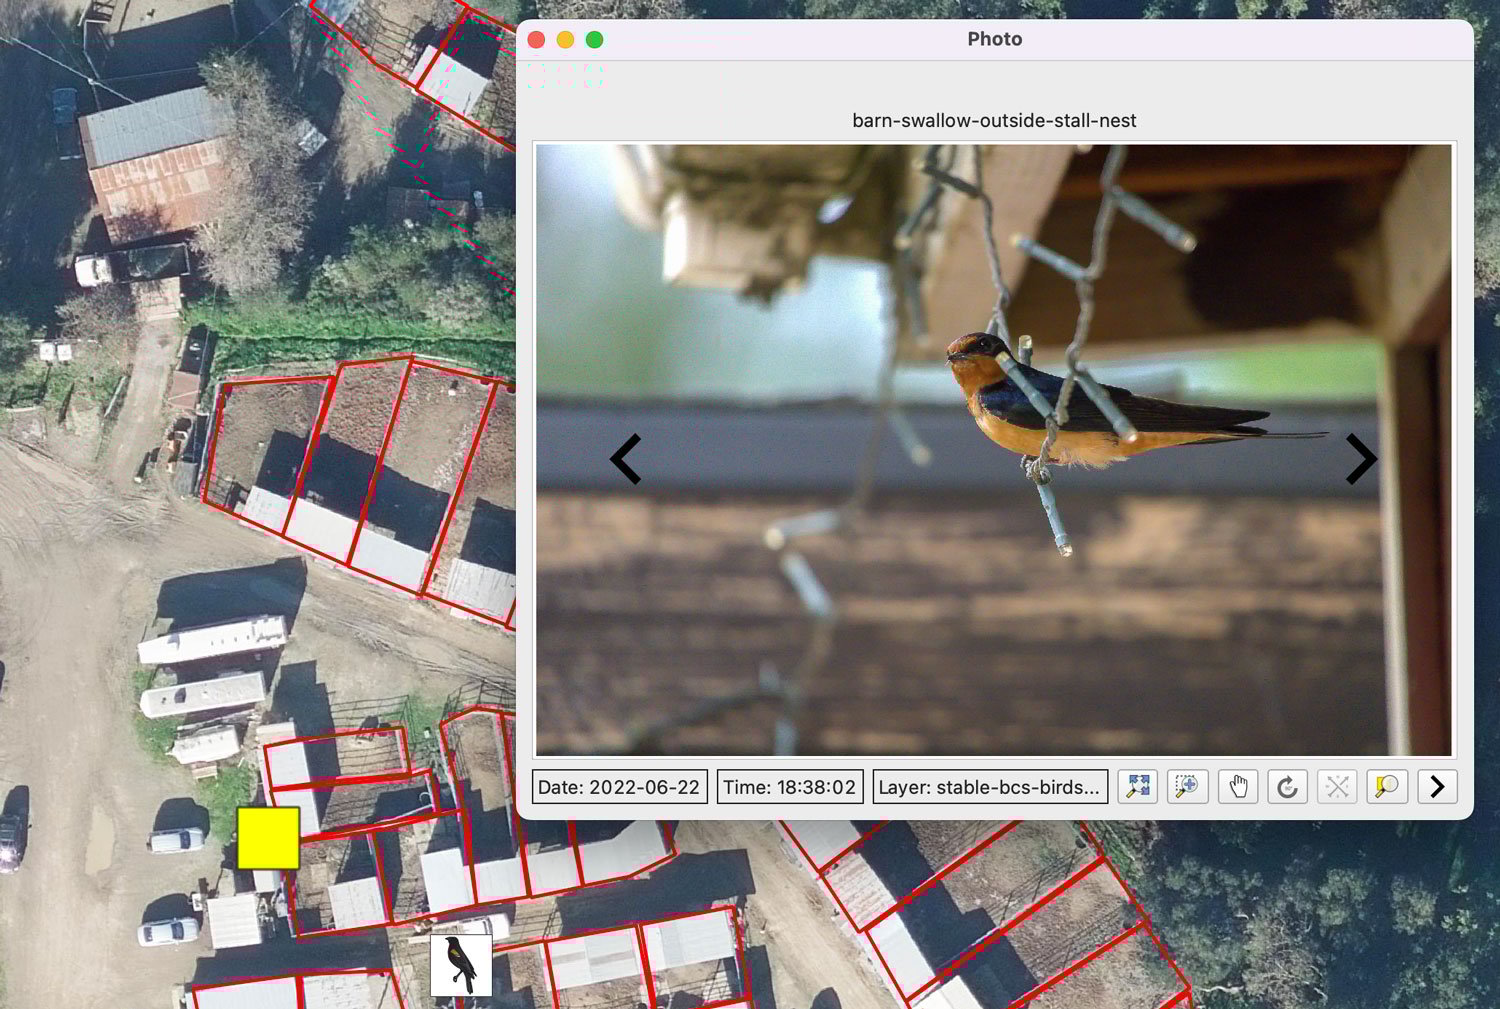
Mapping Geotagged Photos in QGIS
Geotagged photos can be easily mapped out in QGIS by following this GIS tutorial.

Why Climate Change is Making Some Animals More Nocturnal
As daytime temperatures rise, some animals are becoming more active at night to avoid heat stress.

Individual Seabird Adaption to Climate Change
Scientists tracked the migratory patterns of 145 seabirds to map how individual shearwaters are adapting to climate change.

Geography of Atolls
Atolls are ring-shaped coral reefs, islands, or a series of islets that encircle a lagoon either partially or completely.

How Inequality Affects Urban Wildlife
More access to green space and mature trees in wealthier neighborhoods in the United States has also led to a greater diversity of wildlife in those areas.

The Role of Secondary Forests in Reducing Atmospheric Carbon
Secondary forests play an important role in carbon capture strategies aimed towards reducing atmospheric carbon.

Cordiform: Heart-Shaped Map Projections
Heart shaped map projections are known as cordiform map projections which is derived from the Latin "cor" for heart and form for shape.

Nor’easter Storms in the United States
Nor'easters are powerful storms that bring heavy snowfall to the East Coast of the United States, primarily between September and April.

Using GIS to Map an Individual Animal’s Home Range
GIS can be used to model animal home ranges using location data collected through radio telemetry and GPS tracking.

How Normalized Difference Water Index is Used to Map Flooding
The Normalized Difference Water Index (NDWI) is a calculation used in remote sensing to monitor and measure the amount of moisture in vegetation and surface water bodies.

Find Public GIS Data with Google’s Earth Engine Catalog
The Earth Engine Data Catalog lets users search and discover Earth observation public datasets.

Alviso Slough in the San Francisco Bay
The Alviso Slough in the San Franciso Bay is a restored salt marsh that lies in the path of the Pacific Flyway.

What is the Outlook for California’s Atmospheric Rivers?
During the winter months, atmospheric rivers carry enormous amounts of water to the state of California.

Measuring Greenland’s Ice Loss
More accurate geospatial methodologies for measuring ice loss in Greenland indicate that existing approaches may not fully capture the scale of ice melt.

A Review of the State of Crowdsourced Geospatial Data
A review in the Journal of Remote Sensing provides an updated look at the benefits and concerns when it comes to collaborative geospatial data collection.
Using AI to Digitize Data From Scanned Maps
This AI-powered plugin is designed to automate the digitization of data from scanned maps and PDFs in QGIS for GIS users.

Learn How to Georeference a Map in QGIS Using GIS Data
Learn how to georeference a map using GIS data in QGIS with this step-by-step tutorial.

The Coastline Paradox: Why Measuring Coastlines isn’t that Simple
The coastline paradox is the concept that the measured length of a coastline will change depending on the scale of the GIS data used for the measurement.

What is England’s Highest Mountain?
Found at 978 metres (3,209 ft) above sea level, Scafell Pike is located in Lake District National Park in Cumbria.

Sea Otters are a Keystone Species
Keystone species are plants or animals, like the sea otter, whose presence in an ecosystem plays a crucial role in its health.

Mapping Glacier Loss in Western Canada
Researchers are using remotely sensed data and satellite imagery to map glacier loss in Western Canada.

Change Detection Using Kernel Density Analysis in ArcGIS Pro
This GIS tutorial provides step-by-step instructions for how to use two point datasets to detect changes in ArcGIS Pro using kernel density.

Teaching GIS to Kids to Help Them Learn Spatial Skills
Tips and resources to help you get started with teaching your children about GIS and mapping.


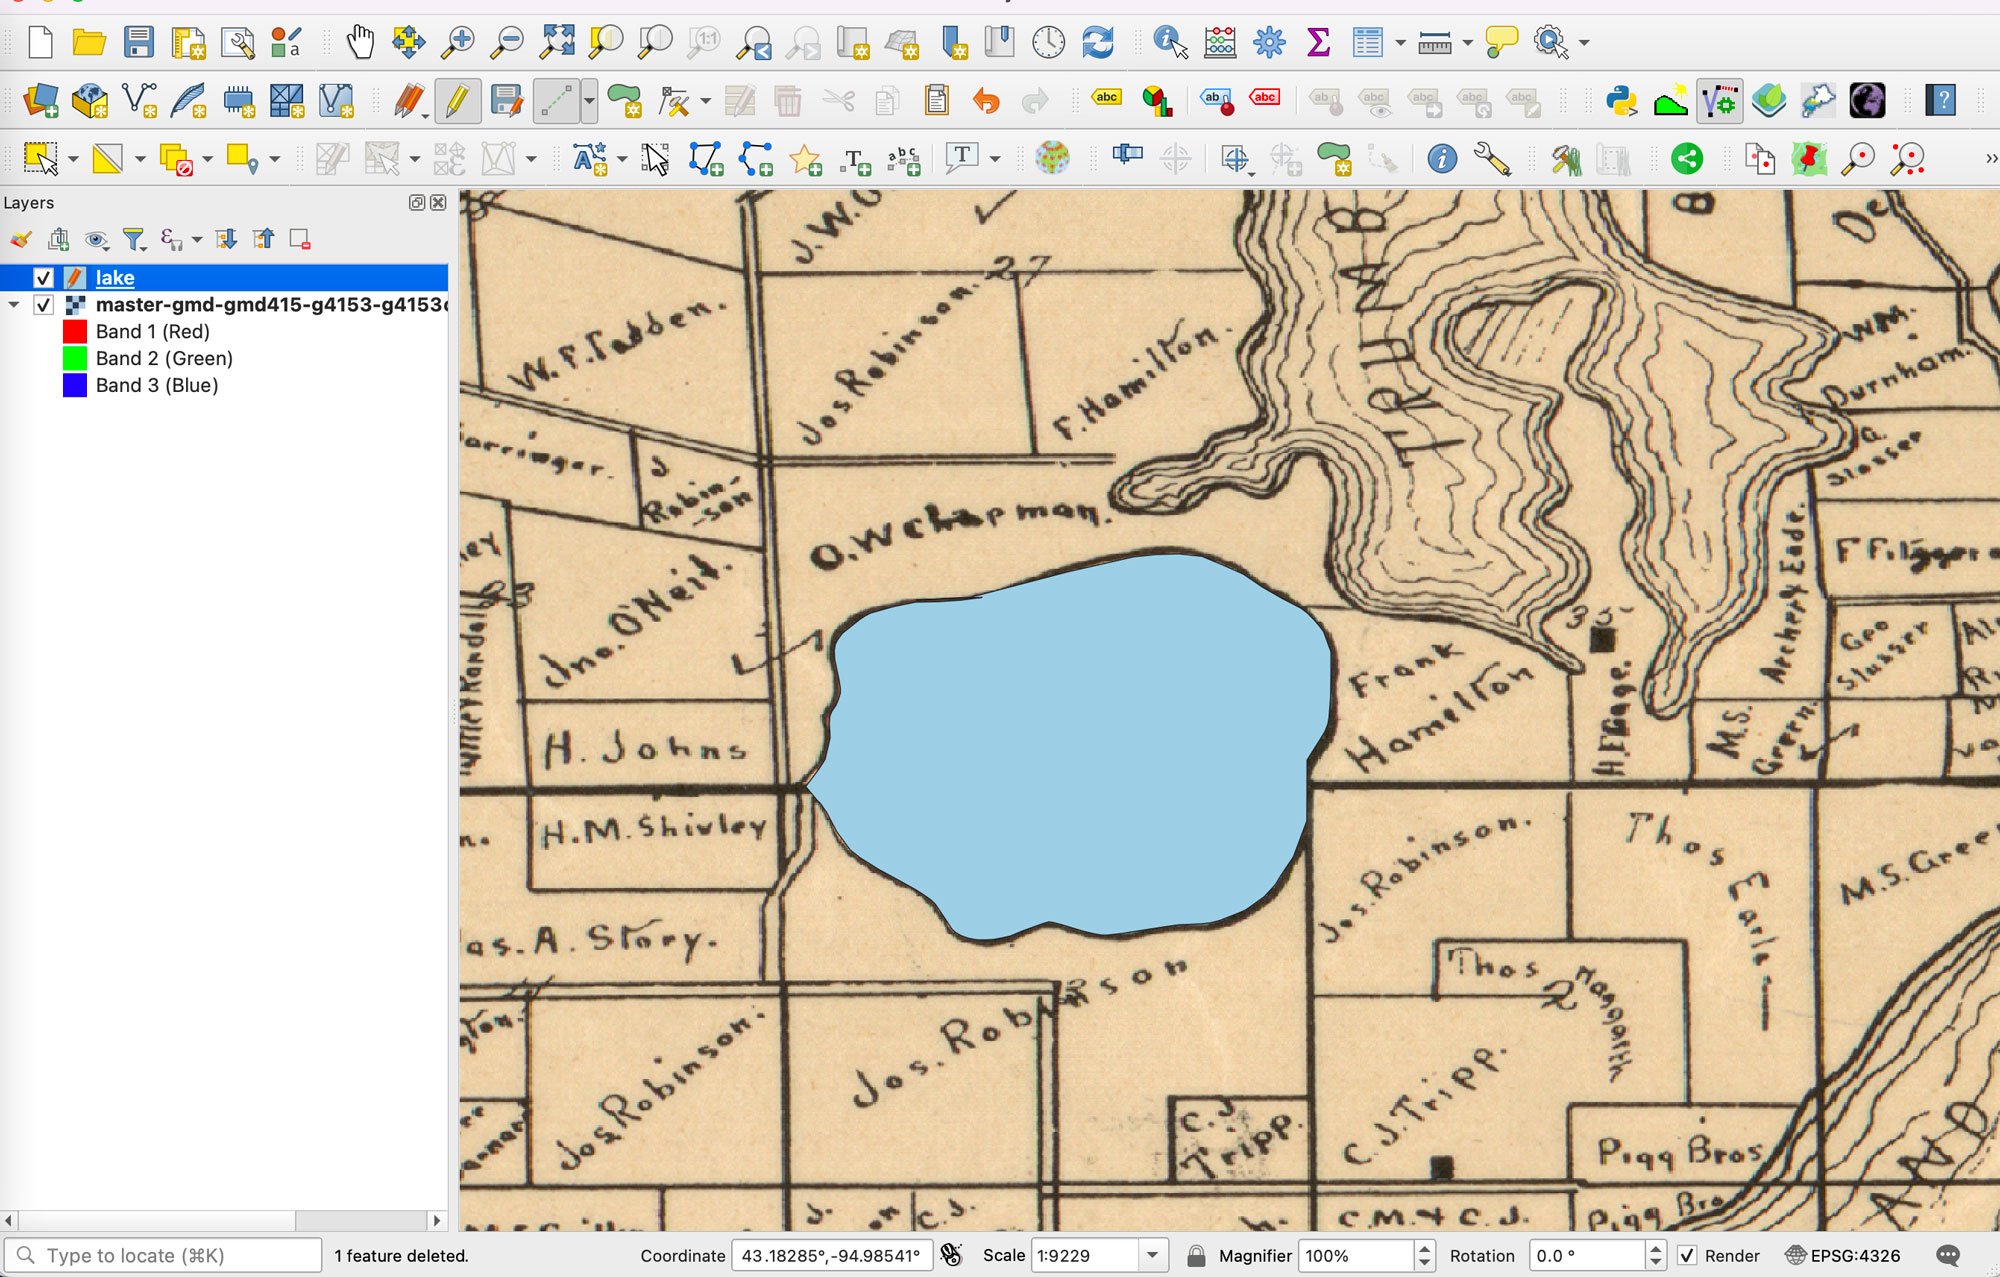
Georeferencing Scanned Maps in QGIS Using Graticules
This GIS tutorial teaches you how to assign geographic coordinates to a scanned map in QGIS using a process known as georeferencing.
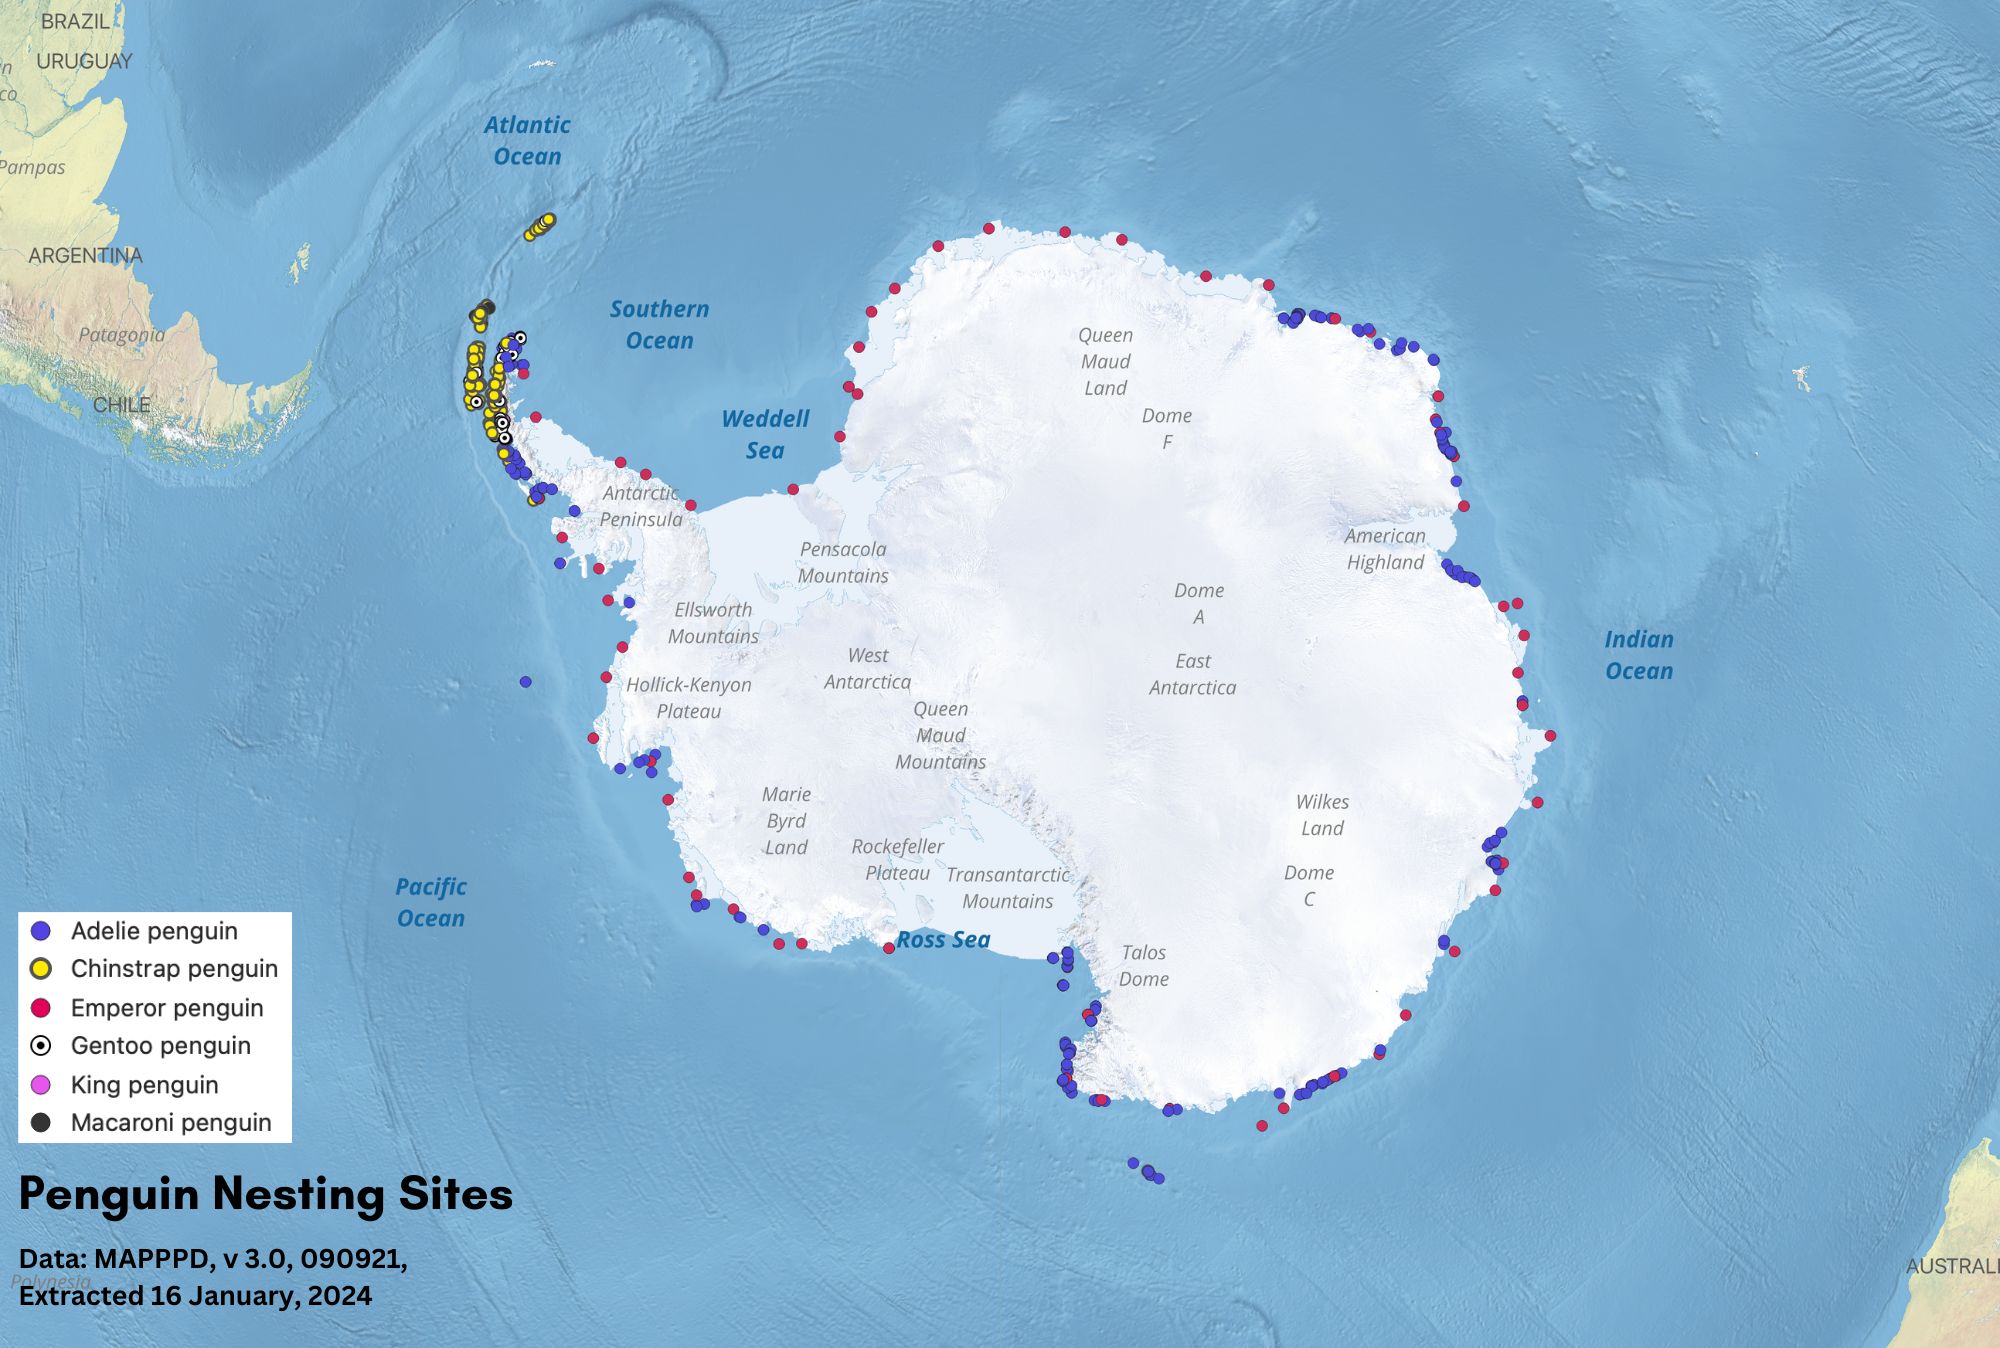
Geography of Penguins
Penguin are agile swimming birds with habitat that ranges from Antarctica to the Galapagos Islands.