
Articles
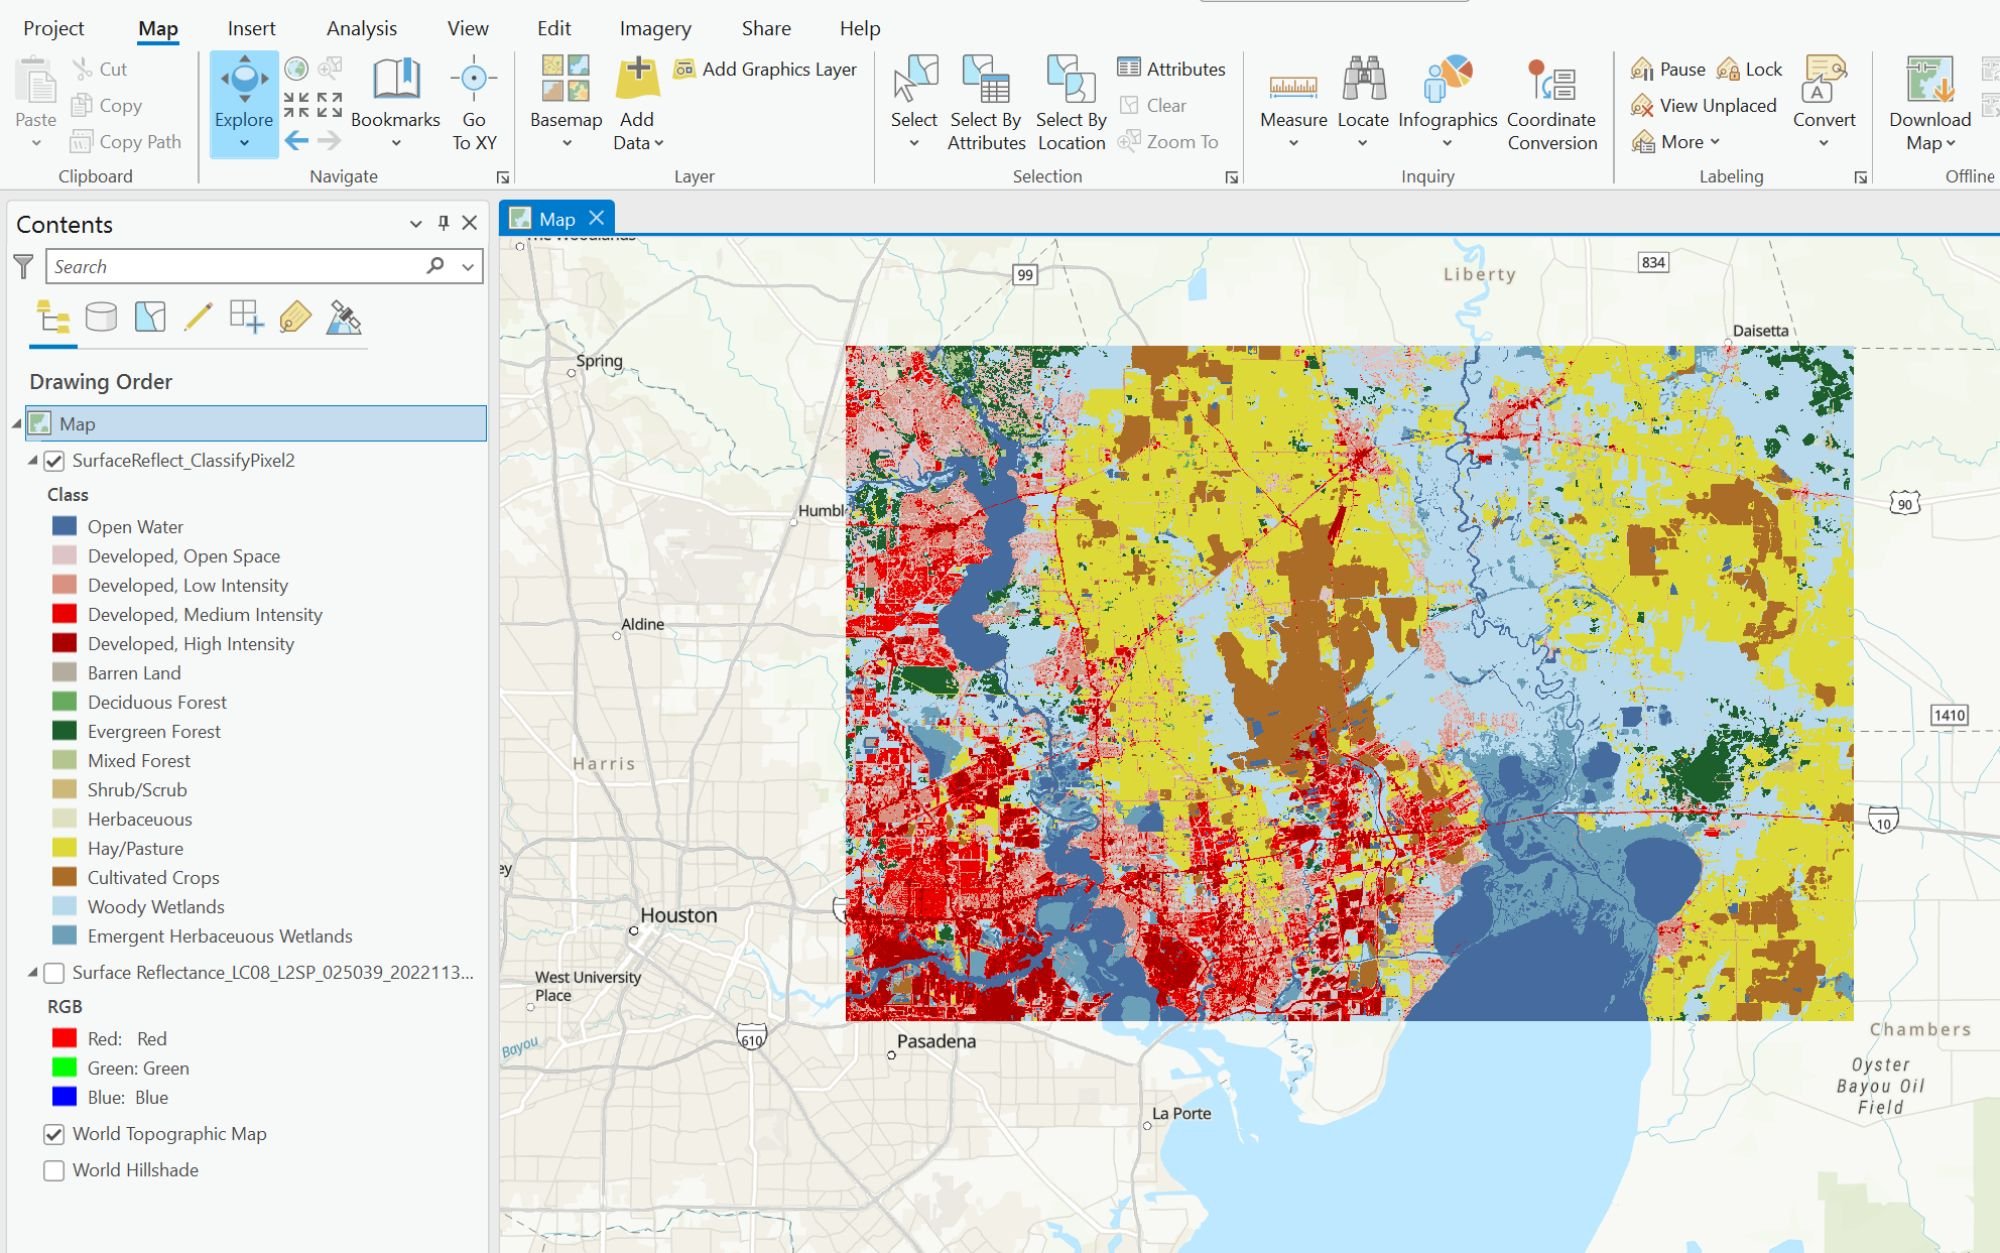
Using Deep Learning to Map Land Cover in ArcGIS Pro
This GIS tutorial provides step-by-step instructions on how to use deep learning models and Landsat 8 satellite imagery in ArcGIS to classify land cover.

Study: More U.S. Homes Burn in Grassland and Shrubland Fires than Forest Wildfires
A new study in Science reports that in the United States, grassland and shrubland fires tend to be more extensive and burn more houses than forest fires.

What Are Microforests? Benefits, Criticisms, and the Miyawaki Method
Microforests, also known as Miyawaki forests, are gaining attention as a way to support biodiversity, cool cities, and restore nature in urban areas.
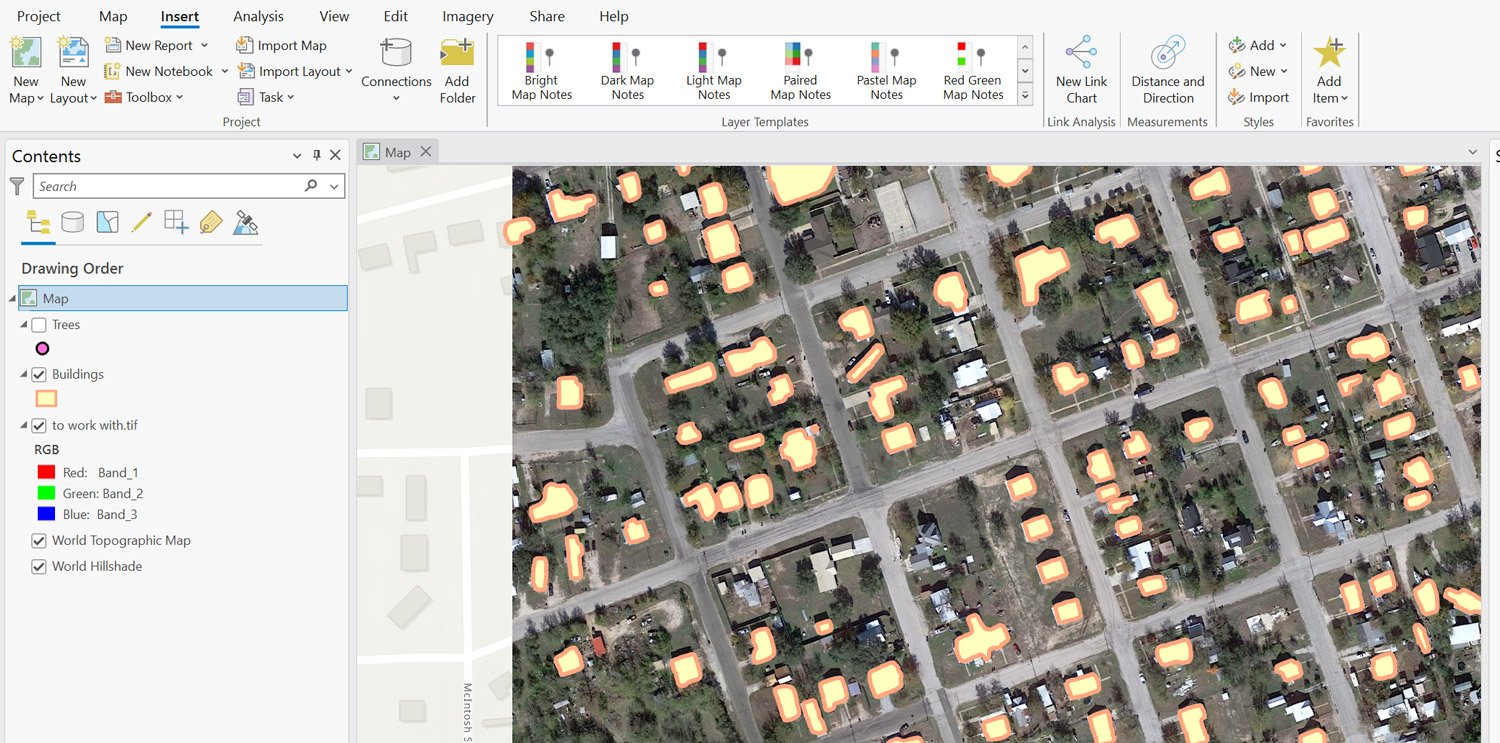
Extracting Building Footprints and Trees from Imagery Using ArcGIS Pro
This tutorial teaches you how to extract trees and building footprints from satellite imagery using ArcGIS Pro.

What is PostGIS?
PostGIS is an Open Geospatial Consortium (OGC)-compliant software that serves as an extension for PostgreSQL, an object-relational database.
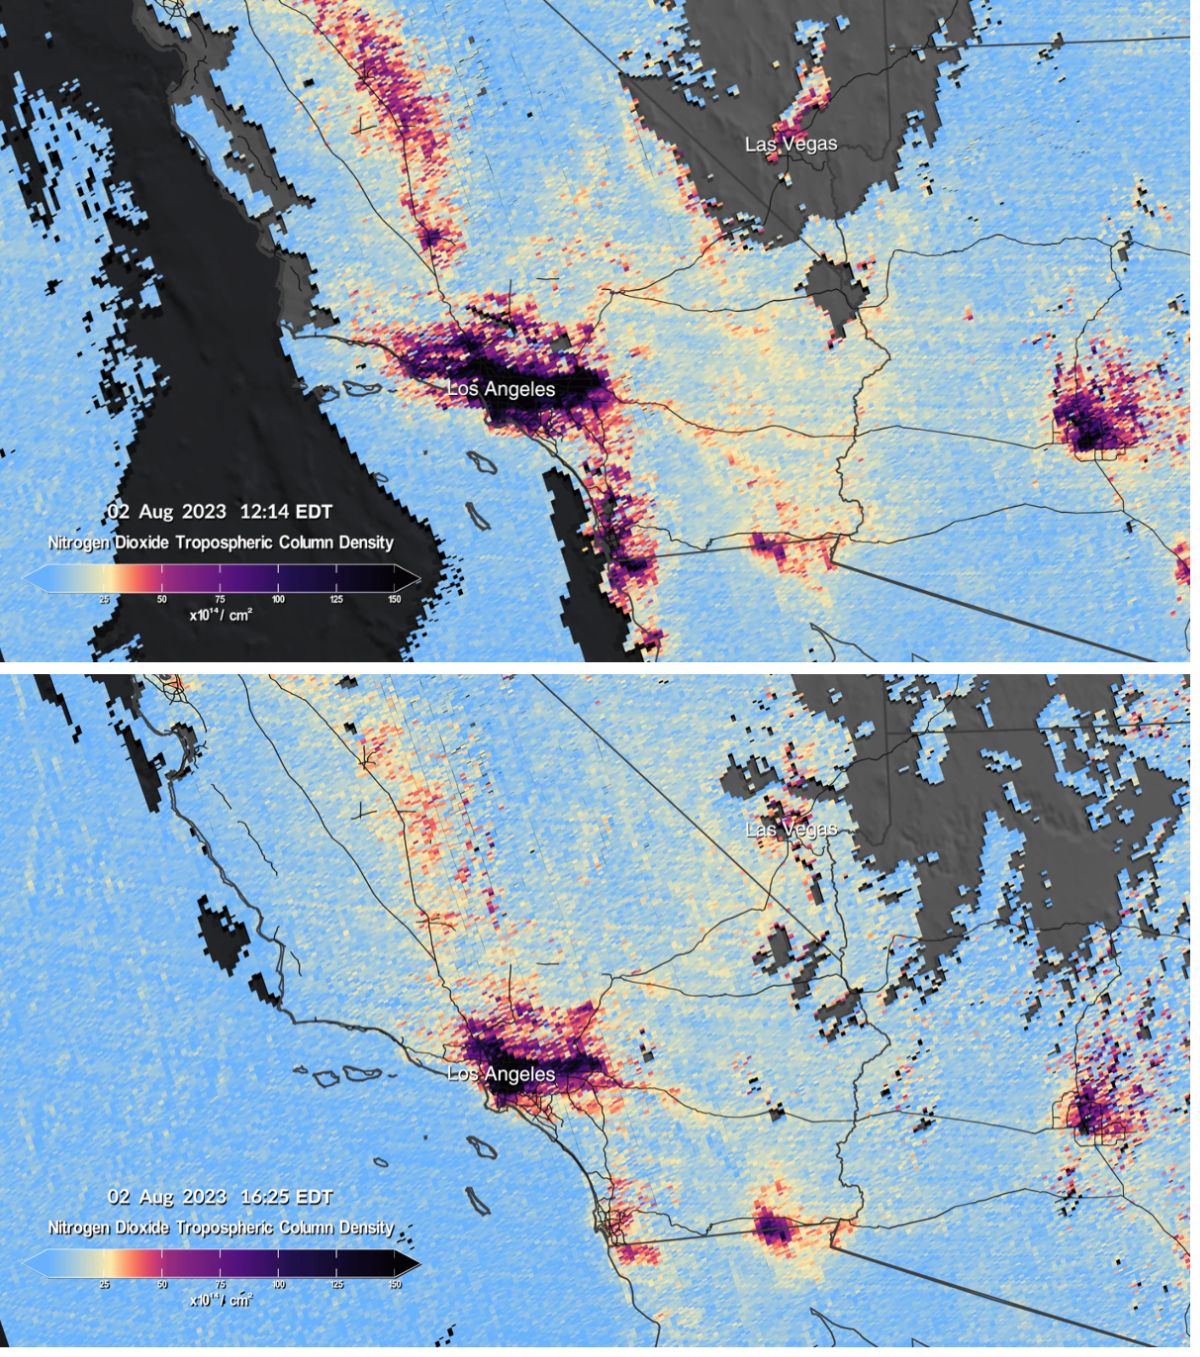
Mapping Air Pollution in the United States
NEMO and TEMPO are two scientific endeavors aimed at producing hourly air pollution maps of the United States.

What is the Difference Between a Crow and a Raven
Here are some ways you can determine the difference between the common raven (Corvus corax) and the American crow (Corvus brachyrhynchos).

Study: Human Activities Have Changed How Wolves Hunt Deer
Logging, linear features, and human infrastructure are changing where wolves hunt for deer.

Rising Sea Levels and Human Migration
Researchers predict that by 2100 between 17 to 72 million people will migrate as a result of coastal land loss due to sea level rise.

Mapping Wildfire Movement
The Fire Events Data Suite is being used to map near real-time wildfire behavior including fire perimeters, active front, and total burned areas.

Analemma: The Sun’s Pattern in the Sky
Analemmas are diagrams and photographs that show the changing position of the Sun and the Earth's moon over the course of a year.

Mapping Earthquakes with ArcGIS Pro
This step-by-step tutorial shows you how to use USGS data and ArcGIS Pro to map earthquakes and geological faults.

Climate Change is Affecting the Color of the Ocean
Researchers are using satellite data to analyzing the levels of phytoplankton in the oceans which are being affected by climate change.

Tallest Active Volcano in Eurasia
With an elevation of 15,597 feet (4,754 meters) Klyuchevskoy is Eurasia's tallest active volcano.

Using Satellites to Map Arctic Amplification
Scientists are using remotely sensed data from Earth observation satellites to map and study Arctic amplification.

Mapping Coral Bleaching With Satellites
Satellite data is being used by scientists to map out where ocean heatwaves are triggering coral bleaching events.

Acorn Woodpeckers in Northern California
Acorn woodpeckers can be found in a range of habitats in Northern California where oak trees are present.

The Gray-Green Urban Divide: How Wealth and Poverty are Visible from Space
Known as the "gray-green divide”, the amount of trees and green space can be an indicator of the income level of the neighborhood.

Largest Island in Alaska
Kodiak Island off the southern coast of Alaska is the second largest island in the United States.

Largest Dome Volcano in the World
Lassen Peak is the world's largest dome volcano with a height of 10,457 feet (3,187 meters).

Third Order Islands
Islands with lakes or ponds that contain smaller islands within them are called recursive islands.

A Harbor in the Center of a Volcano
Deception Island is one of the only places in the world where ships can sail directly into the middle of an active volcano.

Create a Bathymetric Map Using ArcGIS Pro
This step-by-step GIS tutorial shows you how to create a bathymetry map using ocean data from GEBCO.
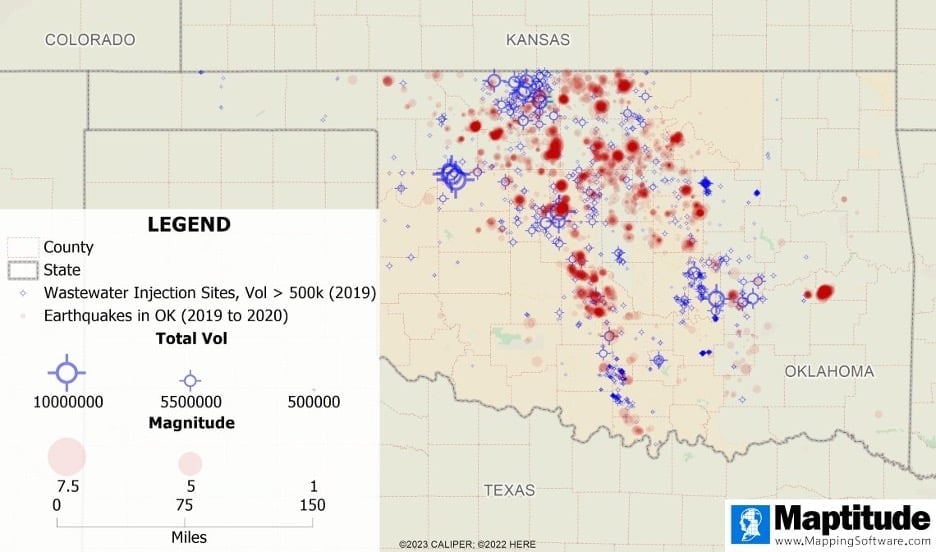
How Mapping Software Helps Us Analyze Earthquakes
Mapping software can help us observe trends in earthquakes, identify areas of high earthquake prevalence, and explore relationships between earthquakes and other phenomena.

Using AI to Design Cities
Researchers now are trying to use artificial intelligence techniques, including deep reinforcement learning, to design more efficient and sustainable urban spaces.

Mapping Buildings in 2.5D Using ArcGIS Pro
Learn how to find and use building footprint data from OpenStreetMap to create a 2.5D map in ArcGIS Pro.