
Articles

Where is the World’s Largest Salt Flat?
Salar de Uyuni in Bolivia, is the largest salt flat in the world and one of the world's largest reservoirs of lithium.

Geography Facts about the World’s Continents
Continents are defined as the largest continuous landmasses on earth.
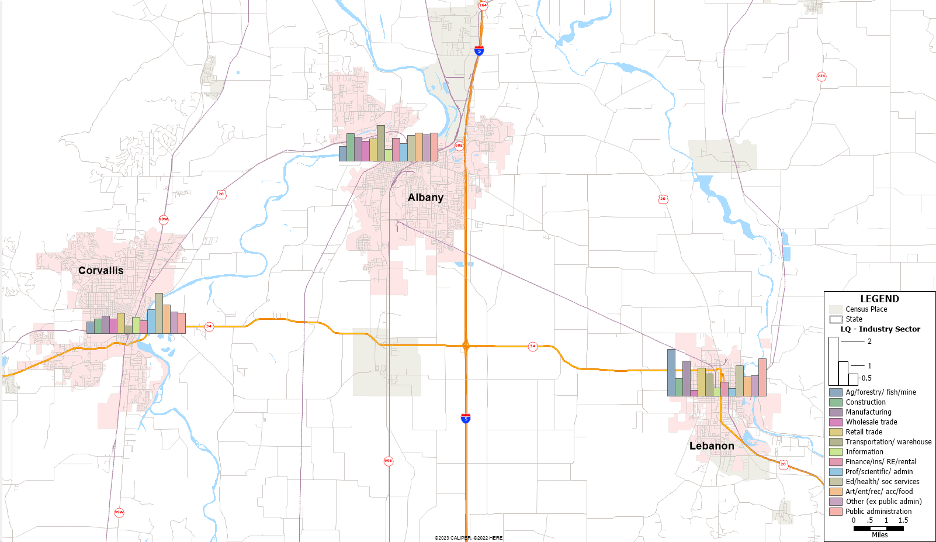
Using GIS to Map Trends in Employment
This tutorials shows users how to analyze ACS data from the US Census Bureau to calculate employment shift-share and location quotient using Maptitude.

Mapping the World’s Tidal Marshes
The first global map of tidal marsh locations was developed using satellite-based imagery.

Mapping Heat in U.S. Cities
NOAA has been coordinating an effort to map urban heat islands in cities across the United States.
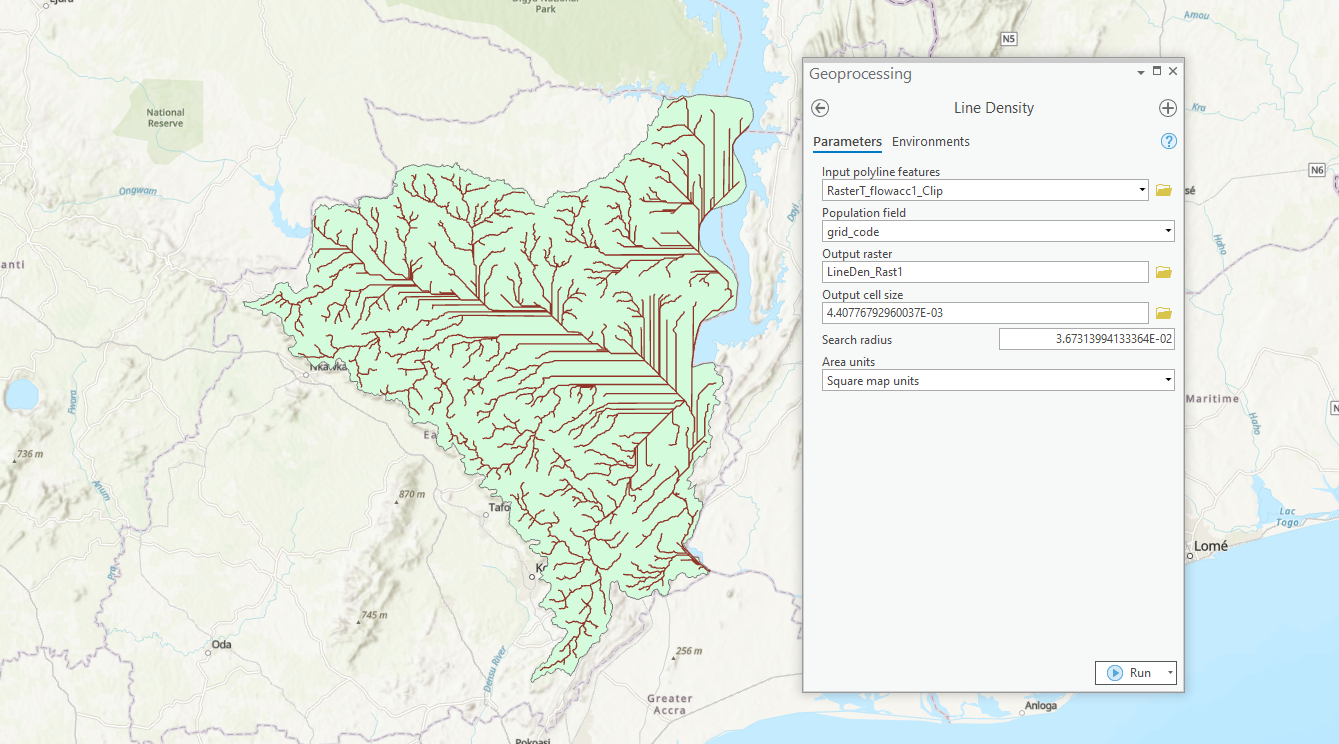
How to Map Watersheds Using ArcGIS Pro: A Step-by-Step Guide
This tutorial shows you how to use ArcGIS Pro to delineate watersheds and drainage paths from elevation data.

Five Reasons to Start Using QGIS
Here are five compelling reasons to start using the open-source GIS platform QGIS, a free and open source software.

What are Graduated Symbols in GIS?
Graduated symbols is one way of visualizing data that can be quantified on a map in GIS.
GIS and Cartography Quotes
Looking for a memorable GIS quote? Check out this growing collection of interesting and notable quotes relating to GIS, cartography, maps, and geography.

A Guide to Understanding Map Scale in Cartography
Map scale refers to the ratio between the distance on a map and the corresponding distance on the Earth's surface.

Timing Mismatch is Resulting in Fewer Birds
A study has found that shifts in the timing of spring seasons, linked to climate change, are impacting bird breeding patterns and leading to less offspring.

Overview of Elevation Data
This article reviews some of terminology and types of elevation based datasets available to GIS.

Interesting Geography Facts About Florida
Show off your knowledge about Florida's geography with these fun and amazing facts.

Warmer Ocean Temperatures are Bleaching Coral Reefs
Higher ocean temperatures, along with overfishing and pollution, are leading to more coral bleaching events.

Wildfires in Canada
Canada's boreal forests are facing a strong start to the 2023 wildfire season in Alberta and British Columbia.

Boreal Forests of North America are Shrinking
Boreal forests in North America are defying predictions of northward expansion in response to climate change.

Wildfires in Hawaii
Fueled by high winds and drought, a wildfire has destroyed much of Lahaina on the Hawaiian island of Maui.

Highly Detailed Seafloor Maps
Researchers from MBARI have developed methods to map the ocean floor at incredibly high resolution.

Phytoplankton Blooms in the Northeast Pacific Ocean
During summer in the Northeast Pacific Ocean, phytoplankton blooms proliferate due to the nutrient-rich upwelling along the continental shelf.

2023 Wildfires in the Western United States
So far in early August of 2023, the wildfire season in the western United States has not been as intense as prior years when a years-long drought was raging.

World’s Largest Freshwater Wind Farm
The world's largest freshwater wind farm is the 89-turbine installation in Lake Ijssel located south of the Wadden Sea in the Netherlands.

Potential Collapse of the Atlantic Meridional Overturning Circulation
A new study predicts that the Atlantic meridional overturning circulation (AMOC) could potentially collapse within this century.

How to Use the Suitability Modeler in ArcGIS Pro
Learn how to use the suitability modeler in ArcGIS Pro to map out suitable areas given a set of criteria.

Mapping Building Heat Using Remote Sensing
Startup Satellite Vu launched the first of a satellite constellation to measure building heat signatures in high resolution.

Florida’s Burmese Python Invasion
The introduction of the Burmese Python into Florida has resulted in the decline of many native mammals in the Florida Everglades.

When Did the Anthropocene Begin?
The Anthropocene is a proposed geological epoch defined by the significant influence of human activity on Earth's ecosystems and geology.