
Articles

Networking in GIS: Peer-to-Peer Support in the GIS Community
List of peer-to-peer resources that GIS professionals can tap into for assistance with their technical queries and to connect with others in the field.

These Butterflies Have the Longest Known Migration Route
Each fall, Painted Lady butterflies (Vanessa cardui) migrate from Europe to subtropical Africa. Individuals can travel as far as 4,000 kilometers.

Sargassum in the Atlantic Ocean Reaches a New Spring High
Researchers using remote sensing data from NASA's Aqua and Terra satellites have measured the largest ever March density in the Great Sargassum Belt.
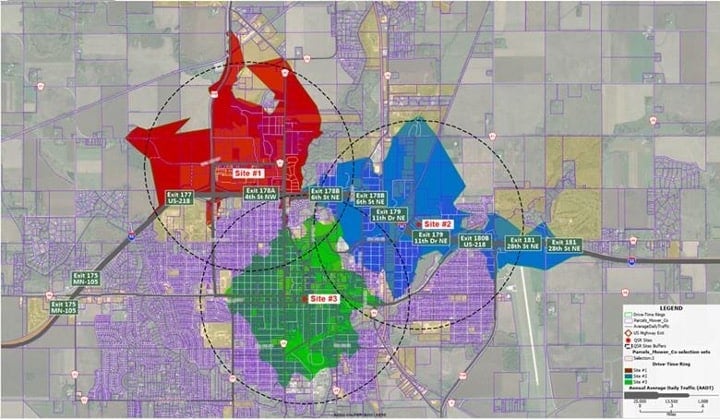
GIS for Local Government: Economic Development and Site Selection
This GIS tutorials shows how to use Maptitude in the municipal government sector for economic development and site selection.

Mapping Snowpack and Forecasting River Rise in California
Measuring snow and forecasting snowmelt effects on river rise is important for planning for California's water needs and to mitigate flooding.

GIS for Local Government: Public Works
This article by Stewart Barry and Brett Lucas describes an application of Maptitude in the municipal government sector for public works.

Wildlife Conservation in the Face of Climate Change: The Importance of Protected Areas
Protected areas are important for providing refuge to amphibians and reptiles impacted by climate change.

California’s Wet Winter Brought Back an Ancient Lake
The once-vanished Tulare Lake reemerged after an exceptionally wet California winter, reclaiming a portion of its historic expanse in 2023.

Which Country Has the Most Time Zones?
Find out which country has the most time zones and how many countries in the world have at least two time zones.
Learn GIS for Free
There are a few online options to learn GIS for free. Take advantage of resources that provide you access to free courses from some of the world's best universities and institutions.

How to Learn GIS
There are many ways to learn GIS. Listed here are guides to learn GIS in a classroom, online, or through self-guided methods.

Finding the Right GIS Program
Choosing the right GIS educational program to set you on the right path towards a GIS career, so be sure to consider all your options before making a decision.

What is the Difference Between a Sea and an Ocean?
A look at the geographic definitions of oceans and seas.

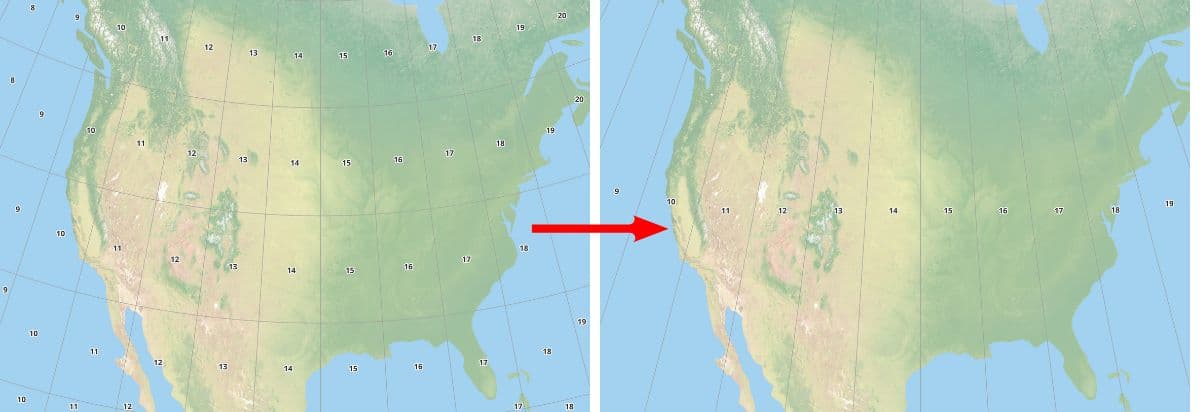
Types of Map Projections
Map projections are used to transform the Earth's three-dimensional surface into a two-dimensional representation.

Why Salt Flats Have a Honeycomb Pattern
Recently published research explains the scientific reason behind the honeycomb shapes found in salt flats.
Dissolve Features Based on Attribute in QGIS
This GIS tutorial provides a step-by-step guide on how to dissolve features in QGIS based on an attribute field.

Oceans Produce Half of the World’s Oxygen
The oceans produce over half of the oxygen in the Earth's atmosphere, making them a vital source of oxygen for life on our planet.

GIS for Local Government: Public Safety
This GIS tutorial from Maptitude shows users how to map out crime and demographics.

A to Z Geography: United States
The geography of the United States is diverse, featuring rugged mountains, arid deserts, dense forests, and expansive coastlines.

Geography of Superblooms in the United States
California's wet winter rains help drive the simultaneous blooming of a large number of wildflowers in the state's desert regions.
How to Find Internships in GIS
Tips for finding a GIS internship: check job boards and internship websites, reach out to local employers, attend career fairs and events, and network.

United States Cropland Data
The Cropland Data Layer (CDL) is a GIS dataset that the USDA updates annually to map the crops grown across the United States.

A to Z Geography: Wisconsin
Wisconsin's geography is dominated by its location in the Great Lakes region, which has created a diverse landscape of fertile farmland, dense forests, and numerous lakes and rivers.

GIS for Local Government With Maptitude: Planning and Zoning
This article explores how to use GIS in local or Municipal Government using Maptitude.

A to Z Geography: Wyoming
Wyoming, the 10th largest state in the United States, is a landlocked state located in the western part of the ...

A Guide to Understanding Map Projections
Map projections are techniques used to transform the Earth's three-dimensional surface onto a two-dimensional plane, inevitably introducing some distortion in area, shape, distance, direction, or scale.