
Articles

Lake Effect Snow
Lake effect snow can occur when dry, cold air moves across a vast lake with warm waters, resulting in a snowfall event.

Walking Cane Maps
Walking cane maps, first created in 1893, featured retractable maps in cane handles. These souvenirs combined practicality with novelty.

License to Travel: A Cultural History of the Passport | Geography Book Review
More anecdotal than history, License to Travel is both an engaging and instructive book.

Triple Divides in the United States
A triple divide is a point on Earth where water from that location can potentially travel into three different watersheds.

Dams in the United States
There are dams in all 50 U.S. states and over 91,000 dams in all.

Heatwaves are Affecting Rivers in the United States
Heatwaves are having an impact on rivers in the United States.

History of Artificial Coral Reefs
Researchers have found success in using submerged ships and other artificial structures to help build coral reefs.

The Map Myth of Bermeja Island
For hundreds of years, cartographers mapped Bermeja Island off the coast of Mexico, but no evidence has been found to prove its existence.

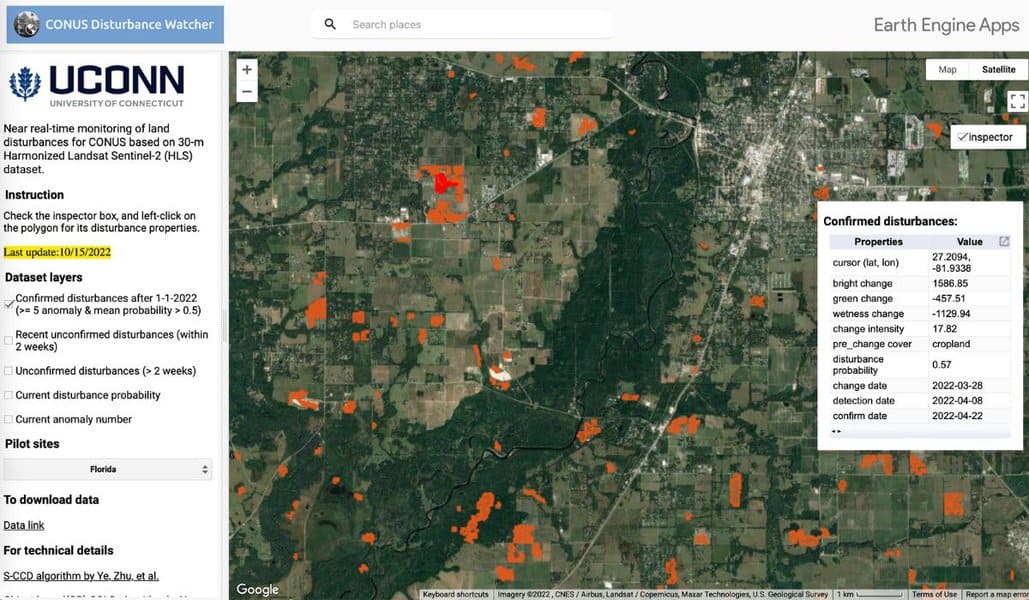
Mapping Long-term Land Use Change with Remote Sensing Data
Discover how remote sensing technology is used to map land use changes, providing valuable insights into environmental impacts and aiding conservation efforts.
Should Maps Include a North Arrow? Exploring the Debate
Do all maps need a north arrow?

Geography of Kansas
Flat expanses, badlands, rolling hills, cuestas, and canyons shape Kansas' geography.

GIS Data: A Look at Accuracy, Precision, and Types of Errors
What are the types of error found in GIS data? This article reviews the difference between accuracy and precision and explains the most common types of error found in GIS data.

Geography of Coral Reefs
Learn about how coral reefs are formed, their growth, distribution, and the looming threats they face from environmental changes.
Using Geospatial Technologies to Map Hurricane Response
Using satellite data and artificial intelligence, researchers have developed a way to rapidly map hurricane destruction.
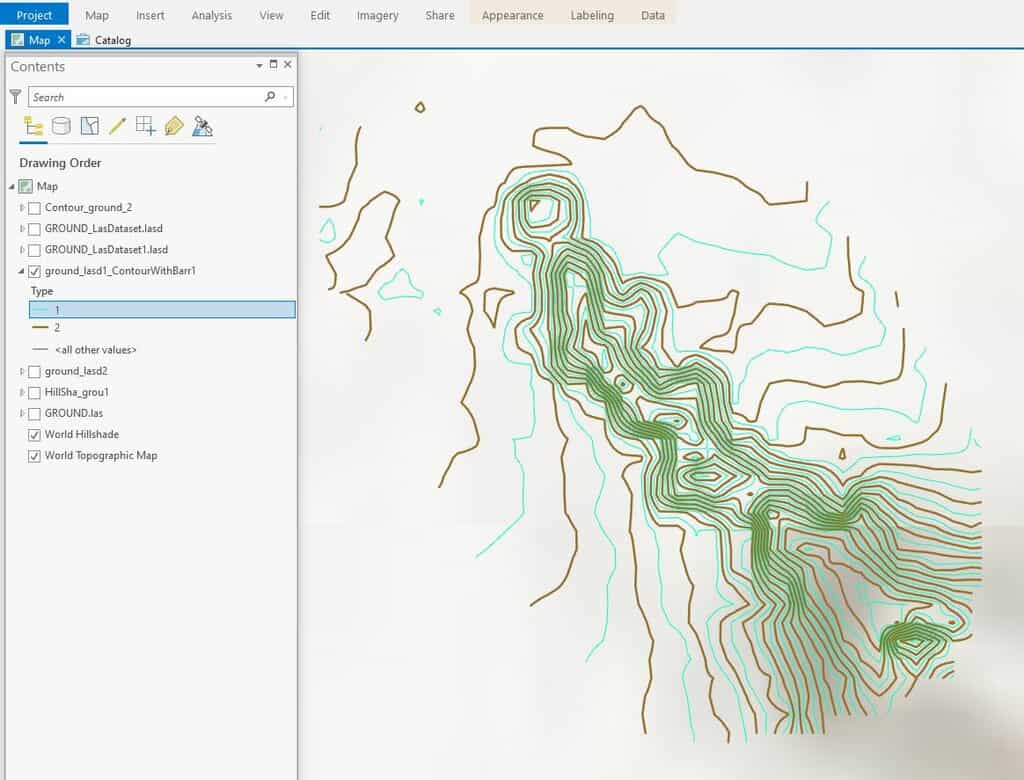
How To Create Contours in ArcGIS Pro from LIDAR Data
This ArcGIS Pro tutorial shows how to add LIDAR data from the National Map to ArcGIS Pro and create topography contours.

Geography Definitions Related to Water
Listed here are geography terms related to water bodies such as lakes, rivers, and oceans.

Mapping Bee Populations: Understanding Distribution and Conservation
Scientists use spatial science to monitor bee populations and address declines caused by insecticides, habitat loss, and climate change.

GIS and Spatial Interpolation Methods
The use of spatial interpolation methods in GIS have proven vital from areas such as public health to interpreting weather patterns.

How to Measure “Land Use Mix” using Entropy in Maptitude
This article discusses Maptitude's "Land Use Mix" add-in. Municipalities utilize land use mix calculations to measure service access.

Mapping Forest Resources
Machine learning, satellite imagery, and data on forest ecology can be brought together to create better information for resource managers by mapping forest resources.

Mapping Caves
Mapping caves has proved difficult, especially vast, complicated caves that can span for kilometers underground.

Open Source GIS and Freeware GIS Applications
There are many open source GIS and web mapping applications to choose from.

Heat Maps in GIS
Heat mapping, from a GIS perspective, is a method of showing the geographic clustering of a phenomenon.

How Reintroducing Wolves Changed Yellowstone National Park
Scientists have documented the trophic cascade effect of reintroducing wolves to Yellowstone National Park.

What is the Difference Between GIS and Geospatial?
There are differences in what the terms GIS and geospatial mean.
Free GIS Books
Most of these free GIS books are available in downloadable PDF format and can be read from a computer or on an eBook reader.