
Elizabeth Borneman

Color Maps Like It’s the 17th Century
The trend of coloring in prefabricated pictures is over 400 years old, and one of the first coloring books ever created is being republished. This early coloring book was of maps and mythical images, entitled Albion’s Glorious Ile.

Climate Refugees
Another kind of refugee situation is growing, one that has nothing to do with politics or wars that displaces people almost indiscriminately, and without regard to factors other than geographic circumstance. This is climate change, and the people who are displaced by rising tides and devastating weather changes are climate refugees.

Why the Canadian Arctic Needs to be Mapped
The Canadian Hydrographic Service is in charge of mapping the Canadian Arctic, but they’ve only gotten about 10% of the way through Canada’s Arctic holdings.
Sunday Maptinee: How Electrical Circuits Inspired the London Underground Map
This edition of the Sunday Maptinee takes a look at the creation of the famous London Underground Map in 1933 by cartographer Harry Beck.

Mapping Soil Moisture in Ethiopia Using Remote Sensing Techniques
Remote sensing can be used to assess soil moisture across a region. Learn more about two methods NASA has used to map out soil moisture in Ethiopia.

Geography of Microbiomes
Researchers have determined that geography seems to be the most influential factor in determining what kinds of microbial life would be found in a variety of local office settings.

Using Song Meters to Count Frog Populations
Conservationists use cameras, acoustic sensors, and audio recording devices to count the red-legged frog in Watsonville Slough, Santa Cruz County.

Using Remote Sensing to Map Rice Paddy Drop in the Mekong Delta
Satellites including Europe’s Sentinel-1A can now track the rise and fall of different agricultural products around the world. The satellite’s imagery showed that rice production in the Mekong Delta has decreased in the past year.

Karakoram Anomaly
Landsat satellite data helped researchers analyze advancing glaciers in the Karakoram mountains, which is uncommon compared to most glaciers worldwide.

World’s Oldest Surviving Terrestrial Globe
The world’s oldest terrestrial globe exists in Germany and shows the world as it was known in 1492 when it was created by Martin Behaim.

National Transit Map
The goal of the national transit map is to find the places in America that are being under-serviced (or not serviced at all) by public transportation.

Geography of Lawns
Lawns now comprise the biggest use of land in the United States. Corn comes right behind grass as the second most grown ‘crop’ in the country.

Where Can You See From the Sea?
Cartographer Andy Woodruff maps out what is directly across the ocean depending on where a person is standing along each continent's coastline.

How Unleashing Two Dams Extended Washington’s Coast
The removal of two dams along the Elwha River in the Olympic Peninsula caused an expansion of the coastline of Washington and created a massive estuary.

What Makes a Vibrant City? Lessons from Data Mining
Researchers in Italy used a collaborative mapping tool, census data, land use data, and mobile phone data to compile information about the movement, interactions and life of an urban area.

New Earthquake Maps from the USGS Also Factor Human Activity Induced Causes
The United States Geological Survey has created a new map that highlights where natural and man-made earthquakes could cause damage around the country.

Using LiDAR to Show How Native American Depopulation Impacted Forests in the United States
Researchers have used LiDAR to understand the impacts of Native American population decline on forest fires in the United States.

Where the US Streets Have No Names
Numerical numbering systems, or numbering streets in specific orders, is one way some cities have taking the pain out of navigation. A comprehensive analysis of streets in the US found that half of the cities here prefer to have their streets numbered rather than named.

Noisy Mariana Trench
The researchers put a microphone encased in titanium and sent it to a depth of six miles in the Mariana Trench. The scientists were able to hear the propellers of passing ships on the surface, the sounds of a storm passing overhead, and the calls of whales.

The Map that Started the Red and Blue Election Map Trend
Historian Susan Schulten has traced the practice of mapping elections of the country by color to 1883.

Using Landsat Imagery to Find Shipwrecks
Satellite imagery from Landsat 8 has been used by a Belgian marine research institute to detect shallow water shipwrecks. Satellite imagery from Landsat 8 can detect the concentration of sand and silt particles in the ocean, which can then be used to pinpoint a potential shipwreck location.

The Great American Solar Eclipse of 2017
For the first time since 1979 a total solar eclipse will be visible from the contiguous United States on August 17, 2017. Called the Great American Solar Eclipse of 2017, the moon’s shadow track will only be visible in the United States.
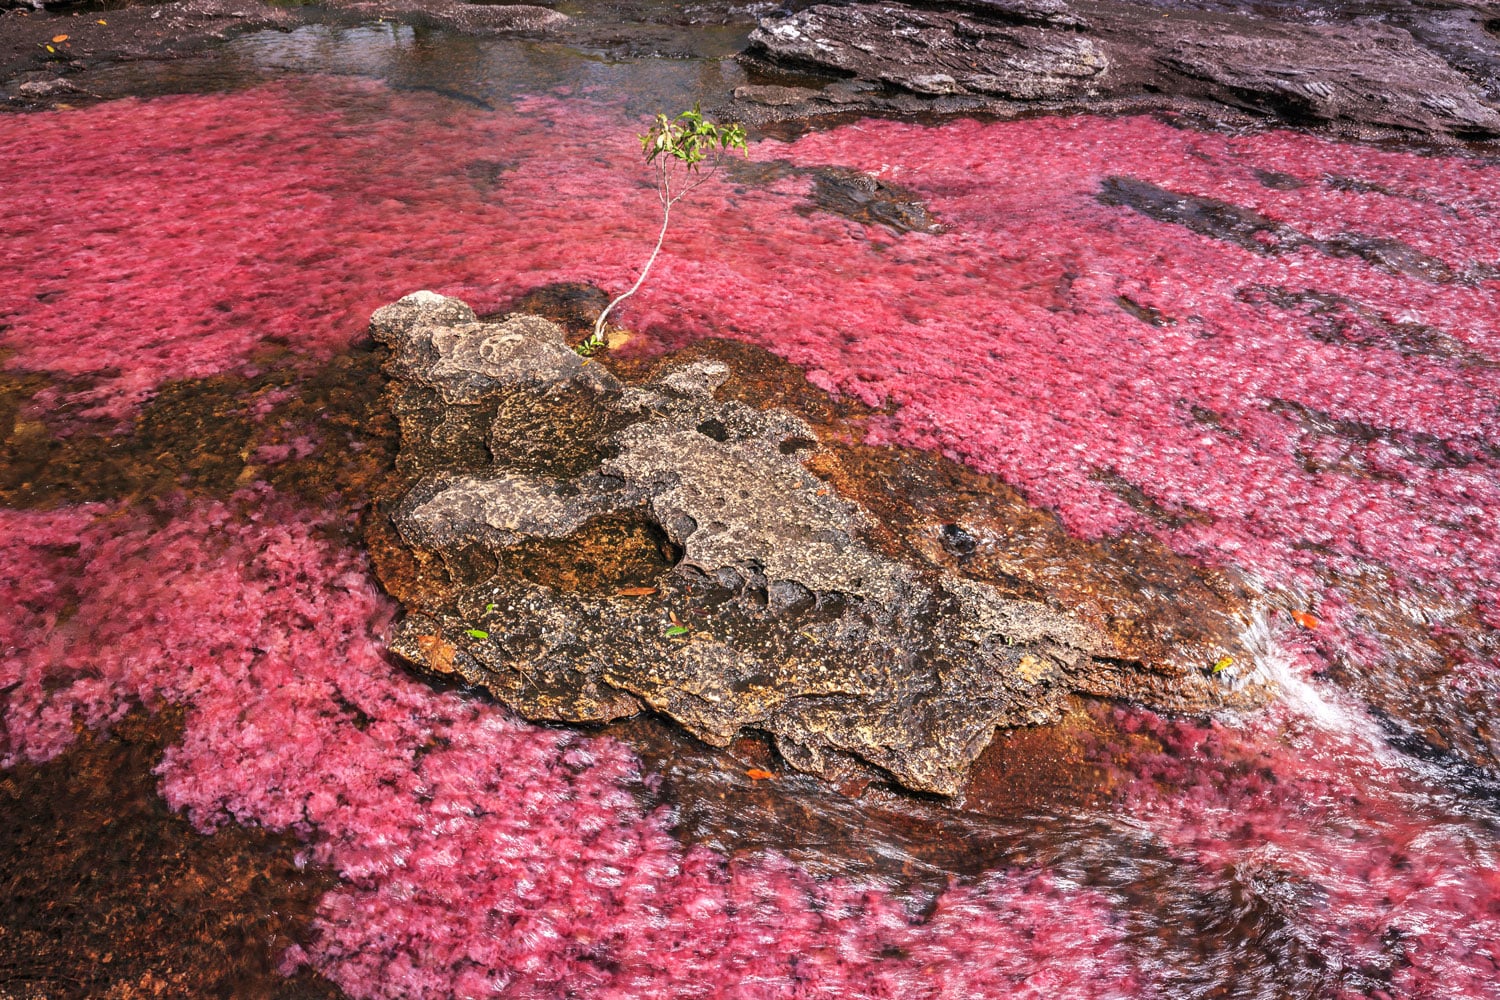
Caño Cristales, the Rainbow River
Caño Cristales, Colombia's River of Five Colors, is famous for its vibrant hues created by the aquatic plant Macarenia clavigera.

What are Gravity Hills?
There are hundreds of gravity hills around the world and they are characterized as places where a geographical optical illusion has been created.

How Continents are Slowing Down Sea Level Rise
The continents of earth are helping slow down sea level rise, a new study shows. Melting glaciers and ice sheets are causing sea levels to change around the world, but the continents are actually absorbing a lot of this excess water.

Eartha: The World’s Largest Revolving Globe
Eartha, housed in the lobby of DeLorme's headquarters is the World's Largest Revolving Globe.