
Elizabeth Borneman

Fantasy Geopolitics: The Gamification of Geography
Teacher Eric Nelson has create a fantasy geography called that combines his love of fantasy football with the study of current events.

Integrating Spatiotemporal Data with Terra Populous
Terra Populus is a project designed to combine data sets and geographic information to facilitate finding and extracting data for research.

Study Suggests that Men Aren’t Better at Reading Maps Than Women
A recent study tested if there are differences in spatial reasoning and perspectives between men and women.
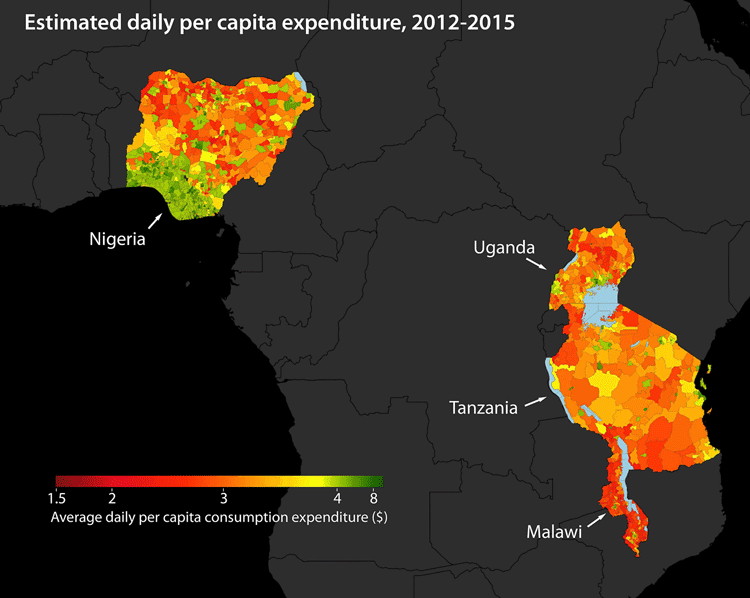
Using Machine Learning to Map Poverty from Satellite Imagery
Satellite images are now being used to map poverty levels around the world using machine learning used to analyze specific poverty data using a convolutional neural network.

Storing Carbon in the Soil Through Regenerative Farming
In partnership with scientists and researchers, farmers are coming up with different ways to keep soil from degrading and releasing more CO2 into the air.

Sunday Maptinee: Teaching Geography Through Humor
The Map Men have created a series of geography themed episodes highlighting some pretty cool information about the world around us.

Mapping the Movement of Migrants
A mapmaker named Max Galka created an interactive map that shows the migration of the world’s human population between 2011-2015 using UN Population Division data

Saltiest Places on Earth
The Dead Sea is one of the saltiest places on Earth, but contrary to popular belief it is not the saltiest location in the world.

Sunday Maptinee: Grid Corrections
A Dutch artist travelled to locations around Oklahoma and Canada to take pictures of the turns and detours that make up grid corrections in the roads.

Cartography of Japan
A new book has surveyed maps created by cartographers in Japan spanning 500 years.

Why the Sun Looks Smaller at Higher Altitudes
At high altitudes, the sun's aureole is much smaller because there is less atmospheric distortion from dust, pollution, or moisture spreading out the sun's visible rays.

Swipe Through Satellite Data to Help Map Vulnerable Populations
MapSwipe and its team of digital volunteers utilize the abundance of smart phone technology to gather more information on natural disasters and the impact they have on people, cities, and countries around the world.

Sunday Maptinee: Imagining the World Anew
Looking at the world in a new way is the inspiration behind the cartography of Ben Hennig.

Improving Satellite Navigation in the Far North
There is currently an effort to extend satellite navigation abilities into the north polar regions for transportation that occurs on land, over the water, and in the air.

Using Satellite Data to Calculate Groundwater
A computer algorithm has been developed at Stanford University that allows researchers to determine groundwater levels using satellite imagery.

Where are the Most Remote Islands in the World?
Here is some information on some of the most remote islands and archipelagos on Earth.

MapWatch: Tracking Political Cartography
Researchers from Northeastern University have created a database called MapWatch which shows how maps and borders change based on geography.

Using Remote Sensing to Automate the Detection of Landslides
The Sudden Landslide Identification Product (SLIP) developed by NASA detects landslide potential by analyzing satellite imagery for changes in soil moisture, muddiness, and other surface features.
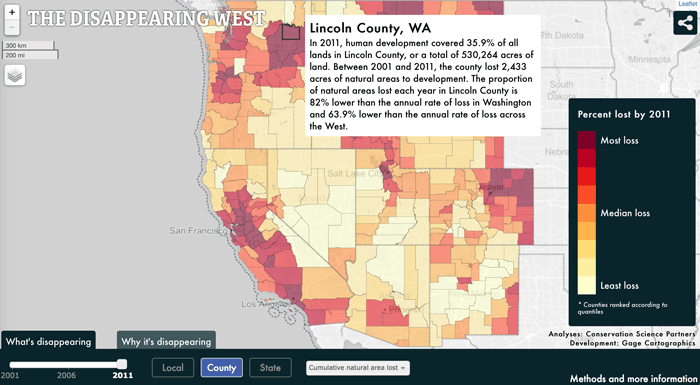
Map Documents America’s Vanishing West
A new mapping study is documenting the vanishing American West, beginning in 2001 and ending in 2011.
Your Dog Licking Your Mouth is a Perfect Example of Exaptation
An example of behavioral exaptation is the practice of wolves licking the mouths of dominant, alpha wolves to show their submission to the hierarchy of the pack.

Explore the Geography of Poetry
An app, called Poetic Places, has been created by Sarah Cole and uses data gathered from the British Library to create a system to identify locations in poems, paintings, and other works of literature.
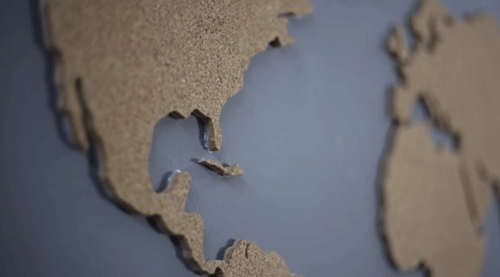
Sunday Maptinee: Build a Cork Map
For a fun map making idea, try a cork world map. This video from Parson Woodworking shows how making to make a map of the world using cork.

Building Missing Weather Data
Called the ENACTS (Enhancing National Climate Services) initiative, scientists are using satellite data in order to estimate rainfall, temperature, and other information to fill in a 15 year gap in climate data collection for Rwanda.

Using Clouds to Map Ecosystem Boundaries
Researching clouds and their impact on ecosystems and species could help researchers find an entirely new way to see the Earth. By looking at clouds, researchers can add a layer of evidence to existing theories and practices of conservation of land and animals.

UCLA Researchers are Using Geospatial Technologies to Identify Potential Ancient Buddhist Sites
Archaeologist Monica Smith and geographer Thomas Gillespie identified 121 locations that they hope will reveal some of Ashoka’s edicts using GIS analys

How Climate Change Is Shifting Sierra Nevada Forests to Higher Elevations
Climate change is causing certain key species in the Sierra Nevada mountains to change where they are growing according to a study published by the journal California Fish and Game.