
Articles

Accessing the Map Canvas, Changing Map Units, and Iterating over Layers
Learn how how to control an object through the Map Canvas, change map units, and how to loop through map layers in QGIS using Python. From: Creating Dynamic Maps from QGIS Python Programming CookBook takes a look at

Free Preview of Mastering QGIS
Mastering QGIS is designed to bring users who want to go beyond the basics of QGIS to an advanced level ...

Working with Coordinate Reference Systems: Mastering QGIS
This section of the free chapter preview of Mastering QGIS looks at working with coordinate systems in QGIS. Mastering QGIS is designed to bring users who want ...

Styling Vector and Raster Data: Mastering QGIS
This section of the free chapter preview of Mastering QGIS looks at styling vector and raster GIS data in QGIS. Mastering QGIS is designed to bring ...

Adding Functionality with Plugins: Mastering QGIS
This section of the free chapter preview of Mastering QGIS looks at using plugins to extend the functionality of QGIS. Mastering QGIS is designed to bring ...

Composing Maps: Mastering QGIS
This section of the free chapter preview of Mastering QGIS looks at making maps in QGIS. Mastering QGIS is designed to bring users who want to go ...

Editing Data: Mastering QGIS
This section of the free chapter preview of Mastering QGIS looks at editing GIS data in QGIS. Mastering QGIS is designed to bring users who want to ...

Working with Tables: Mastering QGIS
This section of the free chapter preview of Mastering QGIS looks at working with tables in QGIS. Mastering QGIS is designed to bring users who want ...

Loading Data: Mastering QGIS
This section of the free chapter preview of Mastering QGIS covers loading different data types into QGIS desktop. Mastering QGIS is designed to bring users who want ...

How Crowdsourced Mapping is Supporting Relief Efforts in Nepal
When Nepal was hit by an earthquake of a icagnitude 7.8 on 25 April 2015, it was a disaster, unprecedented ...

Geointelligence – Empowering Geospatial with Intelligence
Geointelligence is the use of GIS and other geospatial technologies to help with defense and military operations.

What is the Geographic Center of the United States?
What's the geographic center of the contiguous United States? What's the center if Alaska and Hawaii were included?

Big Data, GIS, and Bikes
The Oregon Department of Transportation (ODOT) has set a precedent for public agencies across the country with the purchase of ...

Defining Waterfall and Agile GIS Project Management Styles
Lowell Ballard, the Director of Geospatial Solutions for Timmons Group, takes a look at effectively engaging clients for GIS projects. ...

Using Google Earth to Teach Math
Real World Math uses geography lessons to teach math.

Map of Global Lightning Strikes
NASA has created a world map showing the intensity of lightning strikes from 1998-2013.

Tracking Public Perception about Climate Change
The Yale Climate Opinion Maps track public opinion among adults on attitudes about climate change.

Carbon Budget
The global carbon budget is the amount of carbon gained and lost in the natural and manmade workings of the ...

Pedology
Pedology is closely related to edaphology (the study of the influence of soil on living organisms) and consists of the ...

LiDAR and Rail Utility Mapping and Digital Asset Preparation
Venugopalan Nair, Senior Manager, SBL, discussed why LiDAR is an efficient and quick technology for mapping rail utilities.
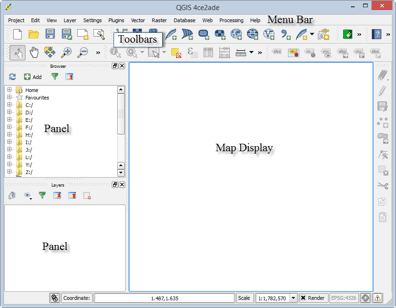
Tour of QGIS: Mastering QGIS
This section of the free chapter preview of Mastering QGIS covers the graphical user interface components of both QGIS Desktop and QGIS Browser. Mastering QGIS is ...
QGIS Download and Installation: Mastering QGIS
This section of the free chapter preview of Mastering QGIS covers downloading and installing QGIS. Mastering QGIS is designed to bring users ...

Learn about GIS in the Cloud
GIS technology and processing in the cloud is on the way to becoming the next big trend. The various functionalities of the cloud can be suitably tailored to fit into an organization’s geospatial workflow.


Reducing Climate Change Could Be More Difficult in the Future
A recent study has declared that limiting climate change in the future could be more difficult due to shifting conditions ...