
Articles

Geography of Tree Extremes
Where are the tallest, largest, and oldest trees in the world?

Tracking Populations Using Sewage
Scientists and researchers have recently begun tracking the populations of cities in the United States using the amount of sewage produced.

David or Goliath: Establishing Your Mobile GIS Portfolio
Lowell Ballard, the Director of Geospatial Solutions for Timmons Group, discusses the David versus Goliath approach in developing robust and full-featured versus smaller more focused mobile GIS applications.

The White Shark Café
The White Shark Café is an area of the Pacific Ocean where great white sharks are fond of swimming.

Desert Carbon Sinks
Research suggest that the world’s deserts may be storing some of the climate-changing carbon dioxide emitted by human activities.

Ice Loss in Antarctica
In the last six years, a 750 kilometer (466 mile) strip of Antarctica has been shedding ice into the ocean at a rate of about 60 cubic km each year according to data collected from Cryosat-2.

Fire Seasons Becoming Longer and More Frequent
Research on fire seasons indicates that around 25% of Earth’s vegetated surfaces now experience a longer fire season.

Using GIS to Evaluate Parking Availability
GPS and GIS can be used to analyze parking space usage in a college town.

Mapping County Demographic Data in R
Learn how to map US County demographic data in R in this article by Ari Lamstein.

Mapping the Link Between Linguistic Diversity and Genes
Researchers are studying the link between language and genetics.

The Urban Heat Island Effect is Triggering Larger and More Spiders
Researchers in Australia have found that the urban heat island effect results in larger and more abundant spiders.

Abstracts from a Day at the 2015 Esri User Conference
Kristina Jacob, a professional photographer and GIS professional, captured some moments from the 2015 Esri User Conference. The annual conference ...

Why Do We Blindly Follow Our GPS?
Stories abound of people blindly following GPS directions, leading to the term "death by GPS". Why do people put so much faith in digital directions?


Map of Where the Population of Europe Is Growing and Where It’s Declining
An interactive map of Europe has been compiled with census data showing areas of the continent where the population is growing and declining.


EJSCREEN: Mapping the Connection Between the Environment and Demographics
EJSCREEN is a mapping app that intersects data sets from recent censuses and environmental maps to help users understand the relationship between the environment and demographics.

How to Build a Smart City in Twenty Steps
Lessons learned from urban planning projects around the world have been summarized into a short, 20-step do-it-yourself guide to building a Smart City.

Geography of Fortune 1000 Companies in 2015
This article takes a look at the basic geographical distribution of Fortune 1000 companies in 2015 by state, city, and ZIP code.

Fortune 1000 Companies List for 2015
Below is an excerpt from the list of Fortune 1000 companies for 2015 and is shown to demonstrate the locations ...

Processing UAV Imagery and its Applications
This article highlights the steps for processing Unmanned Aerial Vehicles (UAV) imagery and GIS data acquisition and discusses areas of applications.

When You Can’t Make Make Mental Maps: Developmental Topographical Disorientation
Developmental Topographical Disorientation is a rare neurological condition that prevents people from creating mental maps of their surroundings and impairs navigation.

River Width GIS Data Created from 1,756 Landsat Images
Researchers used 1,756 Landsat images to develop a GIS database of river widths for the entire North American continent.

Tile Grid Maps
One issue with choropleth maps is that geographic areas that are small in area can oftentimes become indecipherable when viewed on ...

Conjunction Junction Found in the Brain: Helps with Spatial Navigation
Researchers at the University of California, San Diego have identified the area of the brain, the retrosplenial cortex, that helps put together the necessary spatial information for navigation.
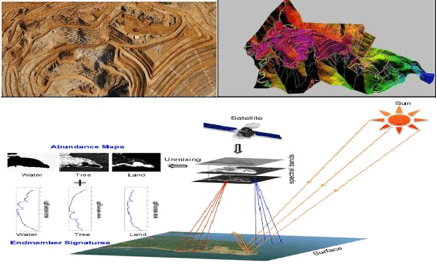
A Brief Introduction to Photogrammetry and Remote Sensing
The following is a brief introduction to photogrammetry and remote sensing for those who are new with the technology, written by Anil Narendran Pillai, Vice President – Geomatics at SBL.