
Articles
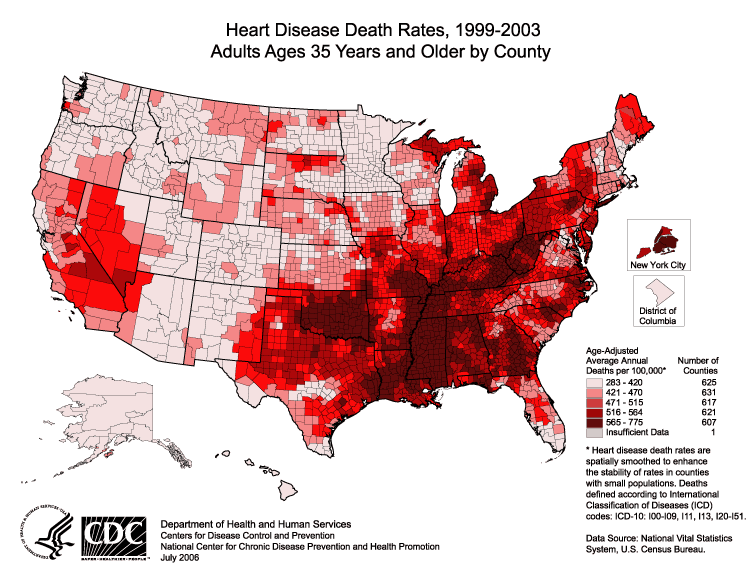
Where Have You Been? Using GIS to Analyze Residential History and Health Care
Troy Lambert takes a look at how the power of GIS can be leveraged to greatly influence healthcare as we know it.

The Only Sea in the World Without a Coast
The Sargasso Sea is a "sea within a sea" with no land boundaries.

GIS in Oil and Gas
The Oil and Gas industry is leveraging GIS through a seamless integration of geospatial technologies like UAV, sensors and existing computer systems.

GIS and IoT Business Applications
Augmenting IoT data with interactive GIS mapping can significantly improve understanding of spatial data.

How to Find a Unique Gift for a Geographer
If you are looking for a unique gift idea for a geographer in your life beyond yet another atlas, globe, or wall map, find some ideas here for unique geographically themed gifts.
The Future of Street Level Photos in Mapping
Using mobile phones, 360-degree cameras, car dashboards and helmet cameras, Mapillary’s users take geo-tagged pictures of the roads they travel which the app automatically uploads to Mapillary’s platform. Then, Mapillary stitches the photos together and turns them into an immersive, navigable, street level view of the world.

Your Mobile GIS Ecosystem
Lowell Ballard discusses the concept of branding your mobile “portfolio” to better create that sense of a unified ecosystem to ensure that clients know that they are using one of your applications.
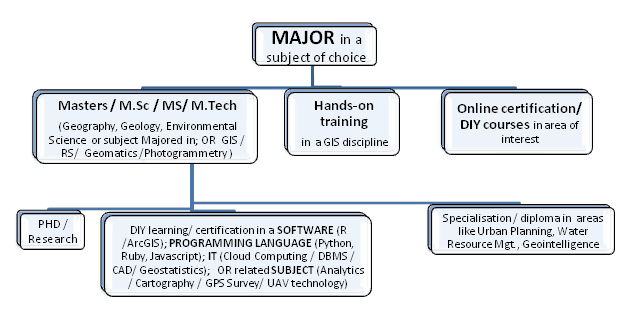
The Many Aspects of a Career in Geospatial
Sangeeta Deogawanka takes a look at the GIS/geospatial arena that is increasingly embracing new technologies within the spatial niche.

WalMap: The App By Walgreens That Maps Out Community Trends in Real Time
Walgreens uses GIS to power its Flu Index Map, visually tracking flu spread for better healthcare decisions and increased public awareness.

Climate Change and Development
Researchers with the London School of Economics and Political Science published a report as part of the Pathways to Resilience in Semi-Arid Economies project that looks into reconciling economic development and poverty alleviation with climate change.

When it Comes to Geography Introverts Prefer Mountains
Researchers wanted to find out if introverts prefer a certain type of topography.

Using Remote Sensing to Count Trees
Tree count management using remote sensing techniques is important for sustaining conservational stability and ecological biodiversity.

Cloud Computing Used to Analyze Landsat Imagery and Detect Deforestation
Landsat, NASA’s longest running initiative for the acquisition of Earth imagery, has generated nearly 50 trillion pixels of data by capturing one image per season, of every place on Earth, for the past 43 years, providing a treasure trove of data for researchers.

Language Development and Geography
Researchers around the world are pooling their resources and knowledge to find out how climate affects language development.
GIS vs. Surveyors Court Case to Start on GIS Day
Instead of celebrating GIS on November 18th, one company will be defending its GIS and GPS services as a case against them will start oral arguments in Pennsylvania.

Map of the Earth’s Antineutrino Glow
A new map of antineutrino emissions has been created by scientists using data collected by detectors in Italy and Japan.
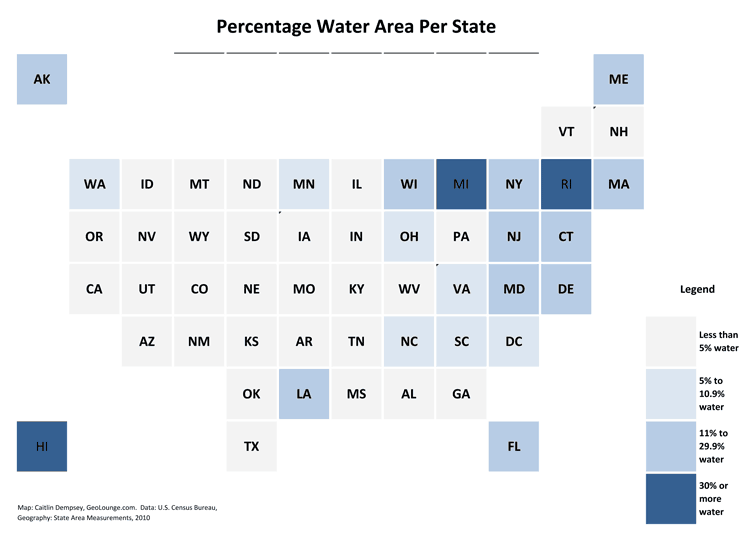
How to Make a Tile Grid Map Using Excel
Step-by-step tutorial for creating a tile grid map of the United States using Excel.
Dissected Maps: the First Jigsaw Puzzles
The earliest jigsaw puzzles were created as educational tools. Known as "dissected maps" these early puzzles were used to teach geography.
Geography of Foucault Pendulums
French philosopher Leon Foucault developed a pendulum to prove that the Earth rotates on its axis. The swing of the pendulum varies depending on its location on Earth.

A Brief History of GIS
From the early days in Canada to the high tech world of internet mapping, the field of GIS is older than you may think.

Data Visualization Strategies Using Tile Grid Maps
A new mapping method has emerged with high-profile news outlets like The New York Times and Bloomberg Business which are using tile grid maps, which represent each state with a congruent square

Manicouagan Crater – The Earth’s Largest Impact Crater Visible from Space
This vivid satellite image shows the "Eye of Quebec", Manicouagan Crater, one of the Earth's oldest and the most visible impact craters.
Researchers: Satellite Imagery Could Boost Wildlife Conservation
An increased number of scientists, conservationists and technology scions are banding together to use their various strengths to benefit conservation efforts to track global biodiversity.

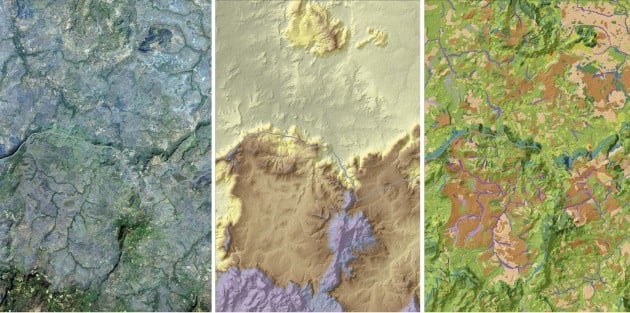
Stanford Geophysicists Map What Lies Beneath Southern California Using High-Resolution Sensors
Stanford University researchers mapped subterranean risks in Southern California by measuring human-induced body waves on city streets and sidewalks.

Five Applications of Satellite Data
To illustrate the benefits, here are five uses of satellite imagery and data.

Spooky Sky Created by a Coronal Mass Ejection
An eerie night sky in Norway as the result of a coronal mass ejection (CME).