
Articles
Commercial GIS Software Applications
Listed below are GIS software packages that provide all-encompassing mapping and spatial analysis capabilities via the desktop.

African Hydropower News
The construction of hydroelectric dams in Sub-Saharan Africa provides the opportunity to bring more power to the region and prepare for rapidly growing populations and offers benefits to health, agriculture, and more

Seafloor Mapped Using Measurements of the Earth’s Gravity Field
Researchers have developed a gravity map used to see the sea floor based on Earth’s gravitational field.

Mapping the Destruction of UNESCO World Heritage Sites
Culture Under Threat Map was launched to highlight the destruction happening to historical sites in the Middle East and North Africa.
The Geography of Gerrymandering in the United States
Gerrymandering is the practice of drawing or re-drawing congressional boundaries to benefit a specific political candidate or party. The Washington Post recently took a look at how gerrymandering has affected politics in the United States.

A Map of the City in the Sky
Known as a light pillar, a combination of ice crystals and the city lights created a map in the sky with definite boundary lines marking streets, intersections, and minor roads in the municipality.

The Geography of Genius
The Geography of Genus, by Eric Weiner, takes a look at where and how geniuses flourish in the world.

The Sound of Satellites
NASA collaborated with architects Jason Klimoski and Lesley Chang to create a way to hear the sounds of different satellites orbiting above the Earth.

Animated Map of 118 Birds Species Migrating
Using millions of observations, scientists from the Cornell Lab of Ornithology have mapped out the migration of 118 bird species in the Western Hemisphere.

Liquid Water on Mars
An article in the Summer 2015 issue of Geography addresses how water and historical climate change have transformed the landscape of Mars.
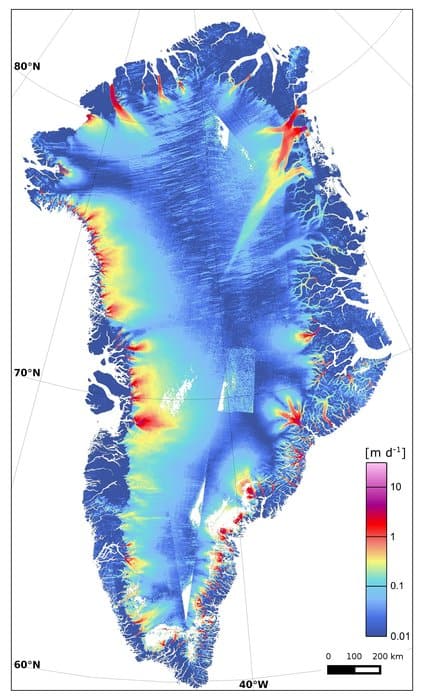
Ice Loss in Greenland
Recent research has shown that one of Greeland’s largest glaciers is losing up to five billion tons of ice every year as it melts into the ocean.
Preparing for Urban Pandemics Using GIS and Resilient IT Systems
Geospatial modeling has found that if 30% of the population voluntarily isolated themselves for 8-10 weeks, the total people infected would drop by almost half.
Providing Good Directions Depends on the Order of the Words
How you order words when giving directions affects how quickly recipients can successfully follow those directions.

Creating Administrative Choropleth Maps Using R
Learn how to create Administrative Level 1 Choropleth Maps in R with this tutorial by Ari Lamstein.

Roads to Rome Mapping Project
Three researchers had the idea to answer their own version of the old question, “Do all roads still lead to Rome?” by mapping out the routes around the world to places named Rome.
Transit Explorer: Mapping all of North America’s Transit Routes
Transit Explorer is a mapping application that visualizes current, planned, and proposed transit routes across Canada, the United States, and Mexico.

Mapping the Impact of California’s Drought on Its Trees
Remote sensing technologies and satellite images were used to map where the California drought is affecting trees the most.

How to Implement an Effective UX Design Strategy
A designer’s voice on the relevance of User Experience (UX) design in modern GIS application development.

Errors in the Fortune 1000 Lists
This article discusses some of the errors prevalent in the Fortune 1000 lists from which the "Geography of Fortune 1000" series is based on.

What is a Shapefile?
The shapefile format is now a common format for storing GIS data. Shapefiles store non-topological vector data along with related attribute data.

Cartography of an Oregon River
Dan Coe used a geospatial technology called LiDAR to map changes in the flow of the Willamette River in Oregon.

Line of Sight: Track the Real Time Locations of Satellites
Line of Sight is an online map application that tracks where each and every satellite is above the Earth in real time.

Make Agile Work for You: Six Practices for Location Based App Development
This article takes a look at the Agile process in use at Timmons Group which focuses on six practices: adaptive planning, iterative development, early delivery, continuous improvement, rapid and flexible response to change, and promoting teamwork.

Map of Carbon Dioxide Levels Over a Year
NASA's Orbiting Carbon Observatory-2 is a major source of information about the life cycle of carbon dioxide on Earth.

Terra Pericolosa and Terra Incognita
Terra pericolosa and terra incognita were terms used by Ancient Roman and Medieval cartographers to indicate either dangerous or uncharted areas on maps.

Who is the Father of GIS?
Roger Tomlinson, known as the "Father of GIS," coined the term "geographic information systems."