
Geo Contributor

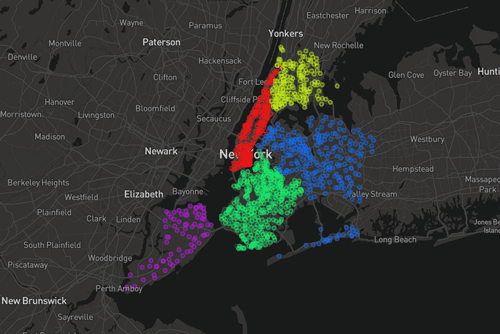
Using Census Data to Define US Commuter “Megaregions”
Researchers analyzed Census data to map out commuter megaregions in the United States.

Using UAVs to Map and Monitor Pipelines
Unmanned Aerial Vehicles (UAVs) are currently being used to not only speed up the pipeline routing process but also to make it both safer and more economical.
How To Make a Map From Open Data Using a Spreadsheet
Jonathan Goldman explains in this tutorial how to extract an open data feed from a civic data portal and pull it into Google Sheets, and then map it quickly using Geosheets.

A Look at KML, an Open Standard to Represent and Visualize Spatial Information
Yang Zhang, associate professor, and Matthew W. McBroom, professor, with Stephen F. Austin State University, provide a brief systematic introduction to KML (Keyhole Markup Language) files.

Use of Earth Observation Data for Oil and Gas
Andrew Cutts, owner of ACGeospatial, discusses the role of GIS and earth observation data in the oil and gas industry in this guest article.

FAO Uses GIS to Protect Agricultural Economy of Vulnerable Countries
Lucia Moro, with the Food and Agriculture Organization (FAO) Geospatial of the United Nations, discusses the agency's work on the development of a global land cover database to support agricultural policy makers and rural land use planners efforts to reduce poverty.

Using the TravelTime Search API to Generate an Isochrone
This step-by-step guide developed by staff at TravelTime shows how to draw a travel time polygon, filter points of interest by travel time and deliver A to B routing information all in one API call.
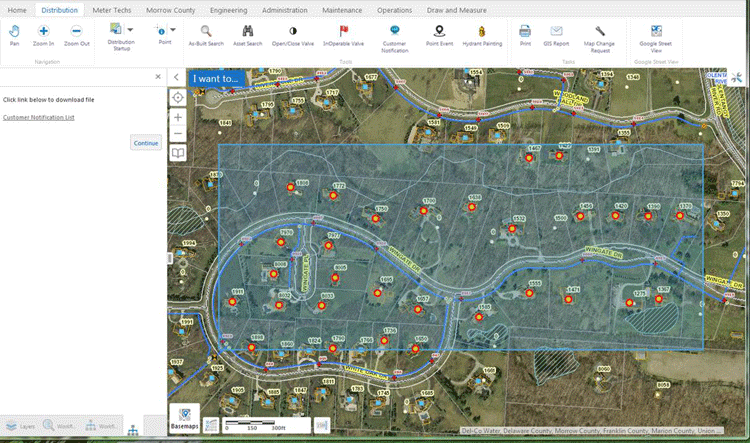
Using GIS to Streamline and Automate Asset Management
Michael Boyd from Novotx writes about how Del-Co Water Company in Ohio uses GIS to to automate workflow processes and streamline operations.

Mapping Outreach Services for Those in Need
A GIS student at the University of Kentucky has created a prototype for a location-based app that serves primarily women who are seeking local services. Summary by Christina DeBlasio

Framework for Protecting Marine Life and Humans from Harmful Algal Blooms (HAB) in the Gulf of Mexico
The US Integrated Ocean Observing System and GCOOS-RA collaborate with local institutions to monitor harmful algal blooms.

Research Vessel Falkor Inspires Name for Newly-Discovered Seamount
A newly discovered underwater mountain was found by researchers off the island of Guam.

Using an Interactive Web and Desktop Based Spatial Technology to Monitor Performance of Public Health Outcome in Developing Countries
FGIS (FHI Geographical Information System) is browser-based interactive data visualization and mapping application that runs on the FHI360 Nigeria intranet, an online resource that serves as a common framework for sharing geographic resources about FHI360 programs in Nigeria.

Mapping of Apparent Fish Available Zones in Indian Reservoirs
This study by Thankam Theresa Paul, Sandhya KM, Manoharan SM and Usha U takes a look at the spatial relationship between physico-chemical variables and fish production using inverse distance weighting.

Thematic Mapping with MapInfo and Excel
This tutorial by Nick Williams, a MapInfo trainer at Acuity Training, aims to provide an example of how data analysis and cleansing using Excel can be combined with presentation and mapping using MapInfo.

Using GIS and a Century of Data to Create a New Geologic Map of Alaska
In 2016, the USGS completed a new geologic map of Alaska using GIS.

Open Source Big Spatial Data with GeoMesa
Bob DuCharme, a technical writer with CCRi, writes about how open source GeoMesa can help users with managing large spatio-temporal datasets. GeoMesa can stored petabytes of GIS data and serve up tens of millions of points in seconds.

How to Embed Mapillary’s Street Level Imagery Into Any Mapping Platform
MapillaryJS is a platform-agnostic WebGL JavaScript library for displaying street level photos which allows for integration with a variety of mapping applications.

A Web Mapping Tutorial for Beginners
This tutorial by Ardit Sulce guides users through how to create a web map using QGIS.

South Dakota’s Custom Enterprise System to Increase Wildlife Management
The Wildlife Inventory and Land Management Application (WILMA) is a web-based application allowing habitat managers to map, track, and report various land management activities on Game Production and Water Access Areas in South Dakota.

Creating Administrative Choropleth Maps Using R
Learn how to create Administrative Level 1 Choropleth Maps in R with this tutorial by Ari Lamstein.

How to Implement an Effective UX Design Strategy
A designer’s voice on the relevance of User Experience (UX) design in modern GIS application development.

Make Agile Work for You: Six Practices for Location Based App Development
This article takes a look at the Agile process in use at Timmons Group which focuses on six practices: adaptive planning, iterative development, early delivery, continuous improvement, rapid and flexible response to change, and promoting teamwork.

GIS and IoT Business Applications
Augmenting IoT data with interactive GIS mapping can significantly improve understanding of spatial data.

The Future of Street Level Photos in Mapping
Using mobile phones, 360-degree cameras, car dashboards and helmet cameras, Mapillary’s users take geo-tagged pictures of the roads they travel which the app automatically uploads to Mapillary’s platform. Then, Mapillary stitches the photos together and turns them into an immersive, navigable, street level view of the world.

Your Mobile GIS Ecosystem
Lowell Ballard discusses the concept of branding your mobile “portfolio” to better create that sense of a unified ecosystem to ensure that clients know that they are using one of your applications.

Your Mobile Portfolio: Make it Your Own
Lowell Ballard, Director of Geospatial Solutions for Timmons Group, discusses the importance of making users feel like a part of your company's ecosystem by developing a mobile portfolio.