
Articles

3D Maps for the Blind
The Geospatial Information Authority of Japan (GSI) is developing low-cost technology to print 3D tactile maps for the blind.

Camels Now Part of Google’s Street View Imagery Program
Google uses many different ways to capture its growing street level imagery, including using trikes, snowmobiles, and trolleys. Most recently, ...

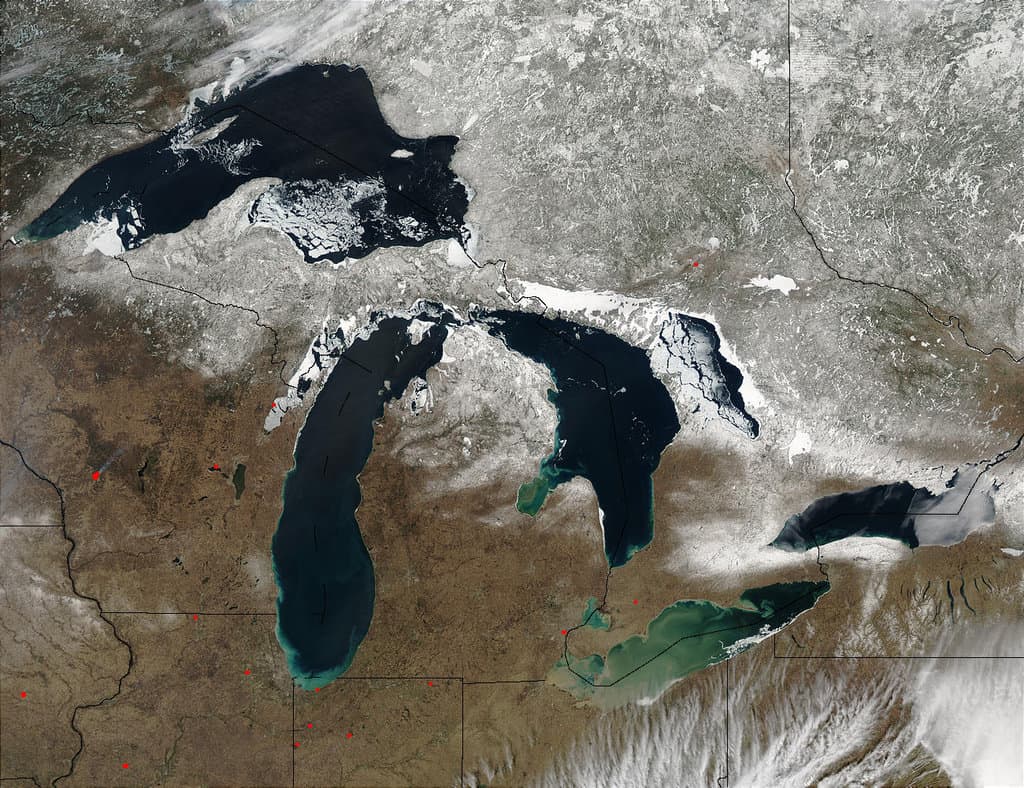
Melt Ponds and the Prediction of Ice Melt
One of the biggest environmental concerns is that of global climate change. Symptoms of major shifts in the Earth’s climate ...
Is the GIS Industry Splitting?
Matt Sheehan, from WebMapSolutions, shares some of the results from a survey asking, "is GIS splitting?"

Was an Inaccurate Map Partly Responsible for Napoleon’s Waterloo Defeat?
A French documentary filmmaker argues that a cartographic mistake played a significant role in Napoleon's army succumbing to defeat by the Duke of Wellington's forces in the Battle of Waterloo.

An Ocean of Mountains
With the help of satellite technology, a team of American and European researchers recently announced that they have discovered thousands of new mountains on the ocean floor.
How Does a Degree in GIS Affect How You Feel About Your Career?
Salary site payscale.com released the results of its 2014 college survey that looks at which college majors pay the best and are ...

New Detailed Map of the Ocean Floor
More than two-thirds of the earth’s surface is covered by deep oceans, yet researchers know one hundred times more about ...

Work on “Inner GPS” in the Brain Wins Nobel Prize in Medicine
Over the course of three decades, two separate research efforts helped unwrap the questions of “how does the brain create ...

Ocean Garbage Patches
Ocean garbage patches are concentrations of marine debris located in the North Pacific Ocean. These garbage patches are comprised of ...

Best Practices for Successful GIS Data Management
Lowell Ballard, Director of Geospatial Solutions for Timmons Group, shares some of his experience on managing GIS data and growing a GIS program.

CryoSat Shows Record Loss of Polar Ice
Scientists concerned about climate change are closely monitoring the thickness of polar sea ice. For many years, ice cover has ...

The Map Myth of Sandy Island
Sandy Island near Australia has long appeared on maps even though it doesn't exist.

How Many Lakes are There in the World?
Using high-resolution satellite images, researchers created the GLObal WAter BOdies database (GLOWABO), which includes all lakes larger than 0.002 km2.
GLOWABO – Remotely Sensed Inventory of the World’s Lakes
A team of researchers used remote sensing techniques to calculate the number of lakes in the world.

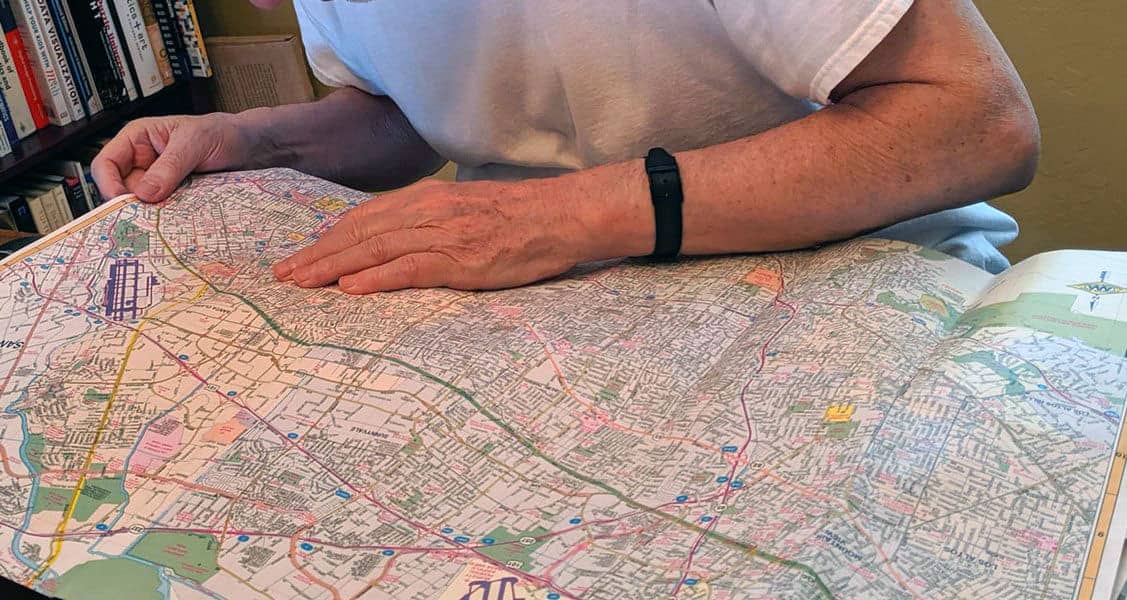
Geocentric Direction Systems
A geocentric direction system is a topography-dependent orientation system.

Improved and More Realistic Minecraft Map of Great Britain
An improved Minecraft map of Great Britain has been released by the Ordnance Survey.
Mind Over Map: How Our Concepts of Reality Affect Map Making and Vice Versa
The nature of maps as portrayals of the world mean that they can both represent physical reality but also create it at the same time.

Measuring Small Variations in the Earth’s Gravity
The NASA–German Grace satellites were launched in May of 2002 in order to map variations in Earth's gravity field.

Measuring Carbon Dioxide and Nitrogen Dioxide Trends with Remote Sensing
Researchers from the University of Bremen published in Nature Geoscience the results of an effort to implement a top-down approach using data acquired remotely.

What is a Geoglyph?
A geoglyph is a work of art which is created by arranging or moving objects within a landscape.

National Geospatial-Intelligence Agency’s Web Mercator Advisory Notice
The National Geospatial-Intelligence Agency (NGA) has an advisory notice warning about errors in the widely used Web Mercator map projection.

Aral Sea Continues to Shrink
Once the fourth-largest inland water body in the world, the Aral Sea shrank again in 2013
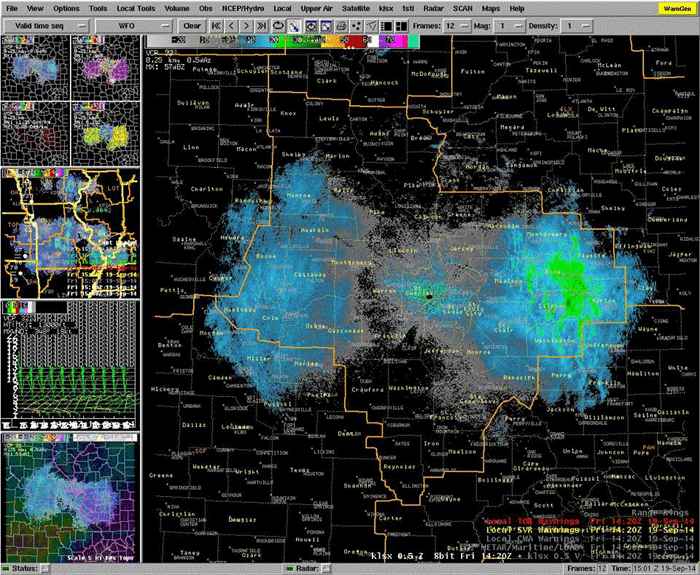
Mass Movements So Large You Can See Them on Radar
The U.S. National Weather Service in Saint Louse, Missouri recently reported that a butterfly shaped pattern on its radar was the result of... butterflies.

Animal Navigation Through Magnetoception
Magnetoception is the ability for certain animals to orient themselves based on the earth’s magnetic field.

Mapping the Outbreaks of Diseases
In August of 2014, the World Health Organization declared a public emergency in response to the growing number of Ebola ...