
Articles

New Project Maps the Loss of Natural Spaces in American West
At DisappearingWest.org, you can actively monitor the loss of natural land as the American West continues to be developed with maps, statistics, and explanations for this trend.

GIS and Human Anatomy
Mapping and monitoring the human body in real time using GIS is one area of great opportunity for medical and healthcare professionals.

Terrapattern: Search Engine for Satellite Imagery
Terrapattern lets users perform "similar-image" searches in unlabeled satellite imagery using deep learning machine vision techniques.

Multi-view GIS
Multi-view GIS provides different perspectives of space and time for a given geographic area.

Climate Refugees
Another kind of refugee situation is growing, one that has nothing to do with politics or wars that displaces people almost indiscriminately, and without regard to factors other than geographic circumstance. This is climate change, and the people who are displaced by rising tides and devastating weather changes are climate refugees.

Real-time Collaborative GIS
Real-time collaborative GIS (RCGIS) enables users, from domain experts to common citizens, to collaborate on given issues and share data easily through a distributed framework.

Why the Canadian Arctic Needs to be Mapped
The Canadian Hydrographic Service is in charge of mapping the Canadian Arctic, but they’ve only gotten about 10% of the way through Canada’s Arctic holdings.

4D GIS and Prediction
For the last two decades, GIS technologies have increasingly been used to incorporate not only spatial relationships but also analyzing and visualizing space across time. Spatial-temporal GIS, or 4D GIS, has, in particular, become essential in areas where GIS is needed for predicting dimensions across time.

Mapping Outreach Services for Those in Need
A GIS student at the University of Kentucky has created a prototype for a location-based app that serves primarily women who are seeking local services. Summary by Christina DeBlasio

Framework for Protecting Marine Life and Humans from Harmful Algal Blooms (HAB) in the Gulf of Mexico
The US Integrated Ocean Observing System and GCOOS-RA collaborate with local institutions to monitor harmful algal blooms.

Research Vessel Falkor Inspires Name for Newly-Discovered Seamount
A newly discovered underwater mountain was found by researchers off the island of Guam.

Using an Interactive Web and Desktop Based Spatial Technology to Monitor Performance of Public Health Outcome in Developing Countries
FGIS (FHI Geographical Information System) is browser-based interactive data visualization and mapping application that runs on the FHI360 Nigeria intranet, an online resource that serves as a common framework for sharing geographic resources about FHI360 programs in Nigeria.

GIS and NoSQL Databases
Relational databases present some limitations to scaling, preventing or limiting the applicability of big data and real-time data problems utilized within GIS. More and more GIS software companies and developers are adopting NoSQL formats where data retrieval is generally faster and easier to structure. NoSQL also facilitates analysis and integration within a variety of tools, which is why open source GIS has proven to be the most useful arena for NoSQL databases.
Sunday Maptinee: How Electrical Circuits Inspired the London Underground Map
This edition of the Sunday Maptinee takes a look at the creation of the famous London Underground Map in 1933 by cartographer Harry Beck.

GIS and Natural Language Processing
Within GIS, natural language processing can be utilized for spatial understanding of where events, places, or people may relate to a given phenomenon.
Proportional Hazard Modeling and GIS
By integrating GIS with proportional hazard modeling, we are now beginning to see GIS increasing its analytical modeling repertoire for the sciences that leverage factors of spatial and time to better understand how emergence and evolution of given processes develops, even when uncertainty is persistent for areas of research.

Mapping Soil Moisture in Ethiopia Using Remote Sensing Techniques
Remote sensing can be used to assess soil moisture across a region. Learn more about two methods NASA has used to map out soil moisture in Ethiopia.

Geography of Microbiomes
Researchers have determined that geography seems to be the most influential factor in determining what kinds of microbial life would be found in a variety of local office settings.

Agent-Based Modeling and GIS
The need to understand emergent phenomenon in a variety of fields has led to not only greater use of agent-based models (ABMs), but we are increasingly seeing tools that integrate GIS with ABMs.

Mapping the Consequences of American Urbanization and Stream Burial
A study has found that much of the area of urban America particularly in the Great Lakes region (8.3% of urban area), the Arizona Sun Corridor (7.1%), and Northern California (10.9%) but elsewhere all over the United States (6.2% total) are “urban stream deserts” in which a city is “riverless... due to the effects of human development and population growth”.

Using Song Meters to Count Frog Populations
Conservationists use cameras, acoustic sensors, and audio recording devices to count the red-legged frog in Watsonville Slough, Santa Cruz County.

Making Nottingham City Council’s Open Data Available
David A. Eagle, Managing Consultant takes a look at how 1Spatial helped Nottingham City Council harness FME in to streamline the availability of open data to the public, reducing its need to spend staff hours on Freedom of Information Act requests.

Using Remote Sensing to Map Rice Paddy Drop in the Mekong Delta
Satellites including Europe’s Sentinel-1A can now track the rise and fall of different agricultural products around the world. The satellite’s imagery showed that rice production in the Mekong Delta has decreased in the past year.

Karakoram Anomaly
Landsat satellite data helped researchers analyze advancing glaciers in the Karakoram mountains, which is uncommon compared to most glaciers worldwide.
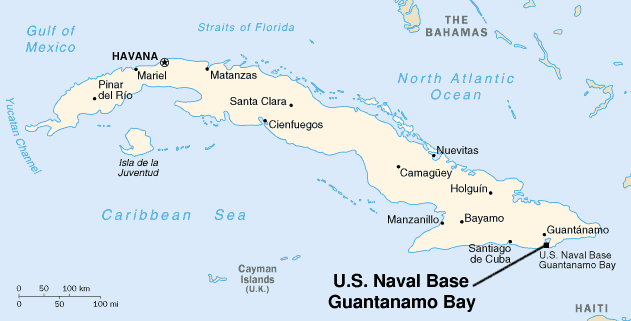
Call for a Guantanamo Bay Marine Research Facility and Peace Park
As Cuba hopes to be seen as environmentally aware and take action in conservation and many in the United States want to distance themselves from the reports of torture and international law violations in Guantanamo, the article in Science calls for the base to transition into a marine research facility.

Explore the Literary Geography of London
Authorial London is a project that geolocates geographic references about London from writers that have lived in the United Kingdom's most populous city.