
Articles

How GIS Helps Small Ships Navigate
GIS has been utilized in sailing and other small craft to help navigate not just the location of other vessels but also land features and obstacles that may arise or even cause danger to boats.

Swipe Through Satellite Data to Help Map Vulnerable Populations
MapSwipe and its team of digital volunteers utilize the abundance of smart phone technology to gather more information on natural disasters and the impact they have on people, cities, and countries around the world.
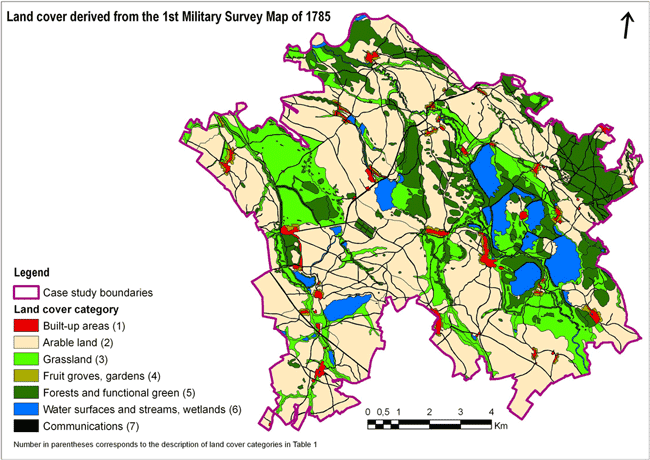
GIS and Modern Research from Historical Maps
While GIS offers a way to digitize detailed historical records and maps, it can also provide a new way to understand history and trends over time.

Sunday Maptinee: Imagining the World Anew
Looking at the world in a new way is the inspiration behind the cartography of Ben Hennig.

Improving Satellite Navigation in the Far North
There is currently an effort to extend satellite navigation abilities into the north polar regions for transportation that occurs on land, over the water, and in the air.

This Interferogram Shows Ground Displacement in Italy as a Result of the Recent Earthquake
The European Space Agency posted an interferogram showing ground displacement as a result of the recent earthquake in Italy.

Using Satellite Data to Calculate Groundwater
A computer algorithm has been developed at Stanford University that allows researchers to determine groundwater levels using satellite imagery.

Where are the Most Remote Islands in the World?
Here is some information on some of the most remote islands and archipelagos on Earth.

View Landsat 8 Imagery With This Free Tool
Users can search, view, and access Landsat 8 imagery with this free online web viewer developed by EOS Data Analytics.

How GIS Helps Drive Hydrography Data
There are more high resolution maps of the Moon and Mars, than the seafloor.

Mangrove Ecosystems’ Importance and Vulnerability to Climate Change
Scientists in Australia have discovered that mangrove ecosystems in Queensland are dying at rates that have never been seen before.

MapWatch: Tracking Political Cartography
Researchers from Northeastern University have created a database called MapWatch which shows how maps and borders change based on geography.

GIS, Elections, and Politics
Political geography focuses on past election cycles in order to look at how voting patterns develop and why. Mark Altaweel discusses how GIS can be used to study those patterns.

Climate Explorer Tool Offers Local Climate Change Maps and Models
Climate Explorer is tool created by a collaboration of many federal agencies that allows users to explore future changes in temperature, precipitation, and heating and cooling days.

Using Remote Sensing to Automate the Detection of Landslides
The Sudden Landslide Identification Product (SLIP) developed by NASA detects landslide potential by analyzing satellite imagery for changes in soil moisture, muddiness, and other surface features.

Use of Earth Observation Data for Oil and Gas
Andrew Cutts, owner of ACGeospatial, discusses the role of GIS and earth observation data in the oil and gas industry in this guest article.

Norwegian Mapmaker Wants to Give a Mountain to Finland for its 100th Birthday
A retired Norwegian mapmaker has proposed that Norway shift its border 660 feet (200 meters) in order to gift the mountain of Halti to Finland in honor of its 100th anniversary independence.

Antarctic Sea Ice Growth: A Climate Change Paradox
Over the course of the last few years, the growth of Antarctica’s sea ice was well documented while the Arctic has experienced ice melt. Different accounts have been given for the paradox at Earth’s poles.
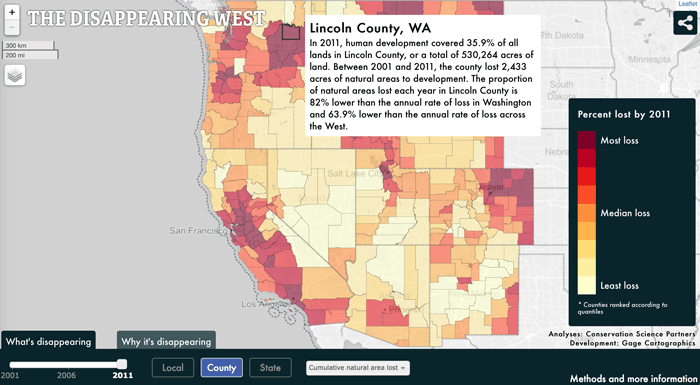
Map Documents America’s Vanishing West
A new mapping study is documenting the vanishing American West, beginning in 2001 and ending in 2011.

GIS and Quick Response Codes
As smart phones and Quick Response Codes (QR codes) have become ubiquitous, it perhaps should not be surprising we are beginning to see applications integrating QR code data with GIS.
Your Dog Licking Your Mouth is a Perfect Example of Exaptation
An example of behavioral exaptation is the practice of wolves licking the mouths of dominant, alpha wolves to show their submission to the hierarchy of the pack.

Using GIS to Map Drug Trafficking
GIS has significantly aided police in crime prevention, notably in fighting drug trafficking.

Explore the Geography of Poetry
An app, called Poetic Places, has been created by Sarah Cole and uses data gathered from the British Library to create a system to identify locations in poems, paintings, and other works of literature.

Which Continent Lies in All Four Hemispheres?
While several of the world's continents are traversed by the separation between two hemispheres, there is only one continent in the world that lies in all four hemispheres: Africa.

FAO Uses GIS to Protect Agricultural Economy of Vulnerable Countries
Lucia Moro, with the Food and Agriculture Organization (FAO) Geospatial of the United Nations, discusses the agency's work on the development of a global land cover database to support agricultural policy makers and rural land use planners efforts to reduce poverty.
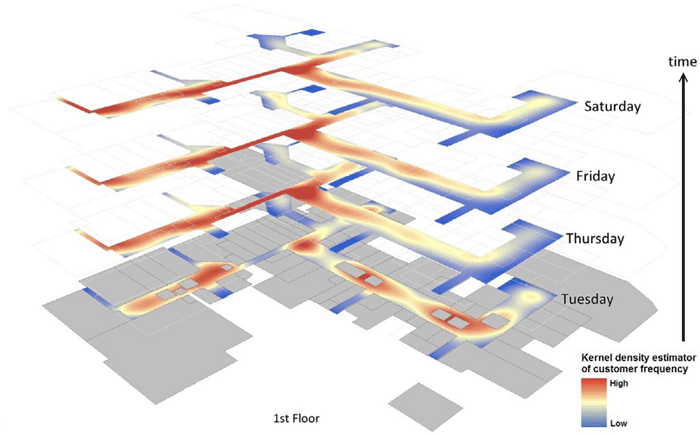
GIS and Small Business Planning
Small businesses increasingly use GIS for spatial analyses like kernel density estimation or Monte Carlo simulation to boost their success.