
Articles
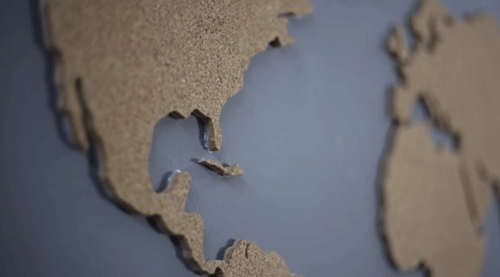
Sunday Maptinee: Build a Cork Map
For a fun map making idea, try a cork world map. This video from Parson Woodworking shows how making to make a map of the world using cork.

Using the TravelTime Search API to Generate an Isochrone
This step-by-step guide developed by staff at TravelTime shows how to draw a travel time polygon, filter points of interest by travel time and deliver A to B routing information all in one API call.
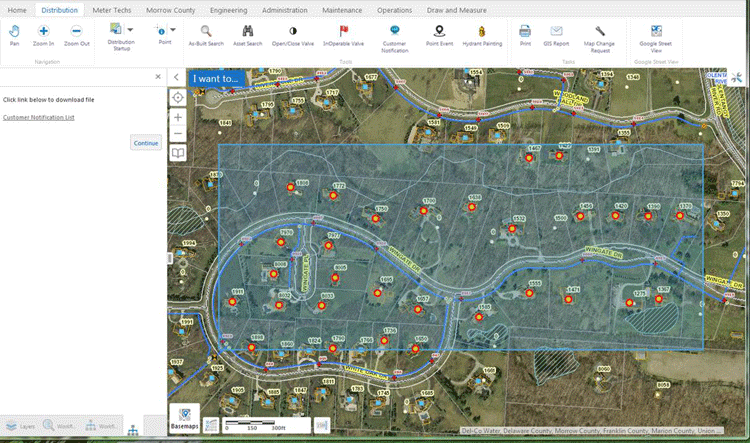
Using GIS to Streamline and Automate Asset Management
Michael Boyd from Novotx writes about how Del-Co Water Company in Ohio uses GIS to to automate workflow processes and streamline operations.

After the Map GIS Data Available
A bonus to the book, After the Map, is the companion site, www.afterthemap.info which offers access to all of the imagery, spreadsheets, and GIS data used in the book.

Mountaintop Removal Mining and Flash Floods in West Virginia
Mountaintop removal mining is when explosives are used to blast through the peak of a mountain and expose coal that is buried below. The practice has destructive consequences on the trees of the mountain, as well as the streams.

GIS and Underground Mining
GIS has been utilized to monitor tunnels and areas explored, as it provides both 3D visualization and abilities to integrate various sets of data for visual and quantitative analysis.

How to Make the Most of QGIS
To get the most out of QGIS it’s not enough to simply know how to write the lines of code you need, and how to integrate with other exciting tools but rather, the more control you have over a tool like QGIS, the more you’ll be able to visualize and explore your ideas.

Life Persists Around Chernobyl
Researchers are studying radiation's impact on wildlife and habitats in Chernobyl's exclusion zone.

Building Missing Weather Data
Called the ENACTS (Enhancing National Climate Services) initiative, scientists are using satellite data in order to estimate rainfall, temperature, and other information to fill in a 15 year gap in climate data collection for Rwanda.

Using GIS to Choreograph Dance
Researchers at Ohio State University developed GIS software to help track the movement of dancers over time to see their patterns, which was also then used to choreograph new classical routines

The Complex Geography of the Brexit Vote
A.J. Rohn takes a look at the geographical factors behind the recent vote in the United Kingdom in favor of leaving the European Union in its controversial Brexit referendum.

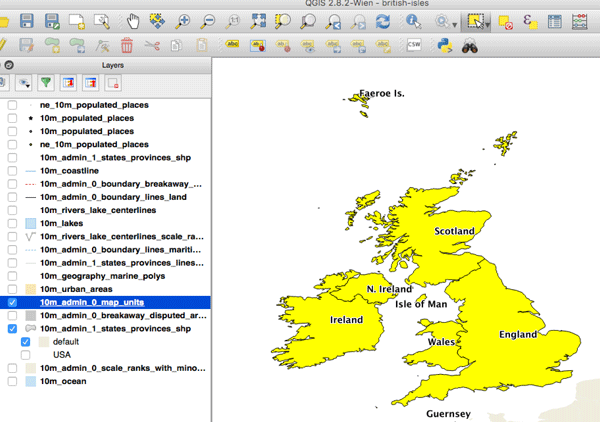
What is the Difference Between The United Kingdom and Great Britain?
This article outlines the differences between the United Kingdom (also known as the UK), Great Britain, and the British Isles.

What is Point Nemo?
Point Nemo is a pole of inaccessibility that marks the furthest location from the ocean to the nearest coastline.
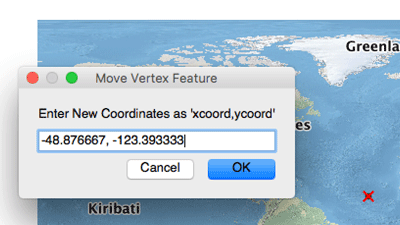
How to Map a Single Set of Coordinates Using QGIS
Here are the steps you need to follow if you want to map a single set of coordinates with QGIS.

Using GIS During Fire Season
Every year, GIS users get better at assembling data and creating meaningful maps that help decision makers predict fires, set fire risk levels, and deploy assets in the most efficient manner possible.
How to Convert a Selection into a New GIS Dataset Using QGIS
Here is a step-by-step tutorial on how to convert a geographic selection from one GIS dataset into a new GIS file using QGIS.

Negotiations Underway at United Nations for Marine Protected Areas
The United Nations is currently developing regulations for ocean waters beyond national boundaries and exclusive economic zones, extending beyond 200 miles.

How GIS is Used to Understand History
Historical geography is one area that has applied GIS to understand outcomes of battles, why cities were built in given locations, and using ancient technologies to understand length and difficulty of travel at different times of the year.

How Many Lakes Does Switzerland Have?
Learn about how many lakes there are in Switzerland and which lake is the largest.

Fighting Drought with Man-made Mountains
As a major drought continues in Africa and the Middle East, the United Arab Emirates is considering a project to create a “man made mountain” and seed the resulting clouds in order to produce rainfall.

GIS and CAD Integration
Mark Altaweel discusses efforts to create a truly integrated system, where CAD components and software concepts work with GIS data.

Using Clouds to Map Ecosystem Boundaries
Researching clouds and their impact on ecosystems and species could help researchers find an entirely new way to see the Earth. By looking at clouds, researchers can add a layer of evidence to existing theories and practices of conservation of land and animals.

Personalized GIS
In personalized GIS, software is being developed to anticipate our needs and provide recommendations based on our behavior, past preferences, and the preferences of others.

UCLA Researchers are Using Geospatial Technologies to Identify Potential Ancient Buddhist Sites
Archaeologist Monica Smith and geographer Thomas Gillespie identified 121 locations that they hope will reveal some of Ashoka’s edicts using GIS analys

How Climate Change is Affecting the Forests of the Sierra Nevada
Climate change is causing certain key species in the Sierra Nevada mountains to change where they are growing according to a study published by the journal California Fish and Game.

Color Maps Like It’s the 17th Century
The trend of coloring in prefabricated pictures is over 400 years old, and one of the first coloring books ever created is being republished. This early coloring book was of maps and mythical images, entitled Albion’s Glorious Ile.