
Articles

Review | The Nocturnal City
Robert Shaw's newly published book, The Nocturnal City, is an effort to delve into the city at night which is a “very different time-space from day.”
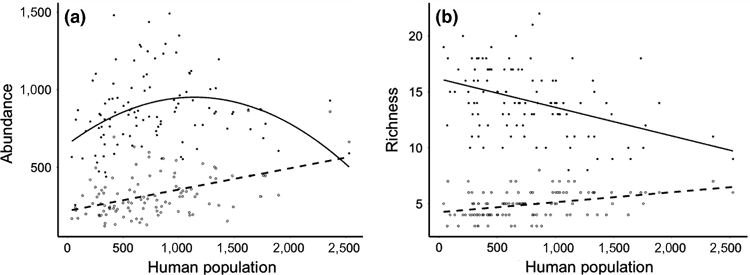
Study Finds a Lower Abundance of Songbirds in Poorer Urban Areas in England
A recently published study looked at the spatial relationship between people and birds across urban areas in Southern England in order to understand patterns of abundance and species richness among birds in populated areas.

King Penguins Like to Maintain Just the Right Amount of Personal Space
Researchers found a liquid-like spacing in King penguin colonies is the result of a balance between territorial pecking and a need to form in large groups as protection against predators.

Viz Palette Helps You Pick Colors for Your Maps and Data Visualizations
There's a new color picker tool to help with selecting a palette for data visualizations.

Marine Heatwaves are Becoming Longer and More Frequent
Researchers, using satellite observations, have found that marine heatwaves are becoming more frequent and longer lasting.

Over 2000 Sentinel-1 Satellite Images Were Used to Create a Map of Land Deformation in the United Kingdom
A new map of the United Kingdom map tracks areas of land subsidence and uplift based on processed data from Sentinel-1's Synthetic Aperture Radar (SAR).

Mapping Minerals with Satellite Imagery
Mapping minerals with remote sensing was one of the main motivating reasons for creating the earliest multispectral satellite systems.

Tool from Sentinel Hub Lets You Create Time-lapse GIFs from Satellite Imagery
The EO Browser allows creating animated GIFs from satellite image time series. This tutorial demonstrates how to create your own time-lapse GIF.
An Eye Protein May Be What Allows Birds to Sense Magnetic North
New research proposes that Cry4, a light-sensitive protein found in the eye's retina may be responsible for magnetoreception in birds.

Visit Almost Four Hundred Years of Mapping Inner Earth With this Virtual Map Exhibit
This virtual exhibit shows different theories and maps that have been created postulating what Earth’s interior looks like throughout history and showed evolution of our ideas of what lies beneath our feet.

Geography and Religion
Geographers study religions and their development based on the role that geography intersects with other important social components within a human geographic approach.

Detecting Flooded Roads From Satellite Imagery
Mapping flood damage by manually examine imagery is a time-intensive and expensive process. New, automated methods using satellite data that compare pre and post-flood conditions are being developed.

Online Accessibility Maps Should be Interactive
For a consistent experience across mobile devices, accessibility maps should be interactive instead of static images or PDFs.

What is a MXD File?
Files with the extension .mxd are ArcMap document files and stands for Map Exchange Document.

NASA Wants You to Send Your Name to the Sun
To celebrate an upcoming groundbreaking mission to the Sun's atmosphere, NASA is inviting the public to submit their names to be added to a microchip which will be placed onboard the Parker Solar Probe.

Using GIS to Study Gentrification
Amid US gentrification trends, municipalities are increasingly using GIS to study its impacts.

The Great Pacific Garbage Patch is Much Larger Than Previously Thought
Researchers using surface trawl samples and aerial imagery surveys have calculated the amount of plastic debris in the Great Pacific Garbage Patch.

The Use of Drones in Human and Physical Geography
With the widespread use of drones, methods are likely to be further refined to improve not only the use of UAVs in physical measurements in geography but even expanded to areas of the social sciences.

Can High Tech Analysis of the Vinland Map Finally Answer Questions About its Authenticity?
Yale University is using high tech imagery analysis such as reflectance transformation imaging (RTI) to determine the authenticity of the Vinland Map, a purported 15th-century world map that has long been widely believed to be a 20th century forgery.

Review | The First Three Hundred Years of Historical Atlases
Though published a decade and a half ago, Walter Goffart's Historical Atlases: The First Three Hundred Years, remains the indispensable reference source for the appearance and development of historical atlases in the Western world.
GIS, Data Preservation, and Gentrification
Olivia Harne discusses how smart planning that incorporates GIS needs to take into account the historic identity of gentrifying neighborhoods.

St. Patrick’s Day Maps and Geography
Find maps about Irish surnames and the geography of St. Patrick's day from the US Census.

Rapid Ocean Floor Mapping
Rapid ocean floor mapping is considered one of humanity’s grand challenges. To highlight this challenge, Xprise recently announced the finalists for its grand challenges competition to rapidly map the ocean floors.

Visualizing Temporal Data with GIS
While mapping spatiotemporal data has remained a challenge, increasingly we are seeing tools that are available on common open source platforms (e.g., R statistical package and QGIS) or commercial platforms such as ArcGIS.

Adding “Early Voting Wait Time” Information to a Layer in ArcGIS.com
Tracy Garrison outlines an example of how a “County” might provide current early voting wait times to the public with ArcGIS.com and coding.
Mapping How Birds Are Affected by Human Activity
GIS and spatial analysis have demonstrated the complexity of how anthropogenic disturbances could affect birds and bird habitats.