
GIS and Geospatial Technologies
Articles focusing on the application of geographic information systems (GIS), geospatial technologies, remote sensing, LiDAR, and Global Positioning System (GPS). These technologies serve as critical tools for understanding and interacting with our physical environment. GIS allows for the mapping and analysis of spatial data Geospatial technologies refer to the various tools used to measure and analyze Earth’s lands and resources. Remote sensing provides a way to collect data from a distance, often via satellites or high-flying aircraft, and is commonly used for environmental monitoring and military applications.
GIS subcategories :
GIS Career | GIS Data | GIS Industry | GIS Learning | GIS Software | GPS | Remote Sensing | Spatial Analysis

How Normalized Difference Water Index is Used to Map Flooding
The Normalized Difference Water Index (NDWI) is a calculation used in remote sensing to monitor and measure the amount of moisture in vegetation and surface water bodies.

Find Public GIS Data with Google’s Earth Engine Catalog
The Earth Engine Data Catalog lets users search and discover Earth observation public datasets.

A Review of the State of Crowdsourced Geospatial Data
A review in the Journal of Remote Sensing provides an updated look at the benefits and concerns when it comes to collaborative geospatial data collection.
Using AI to Digitize Data From Scanned Maps
This AI-powered plugin is designed to automate the digitization of data from scanned maps and PDFs in QGIS for GIS users.

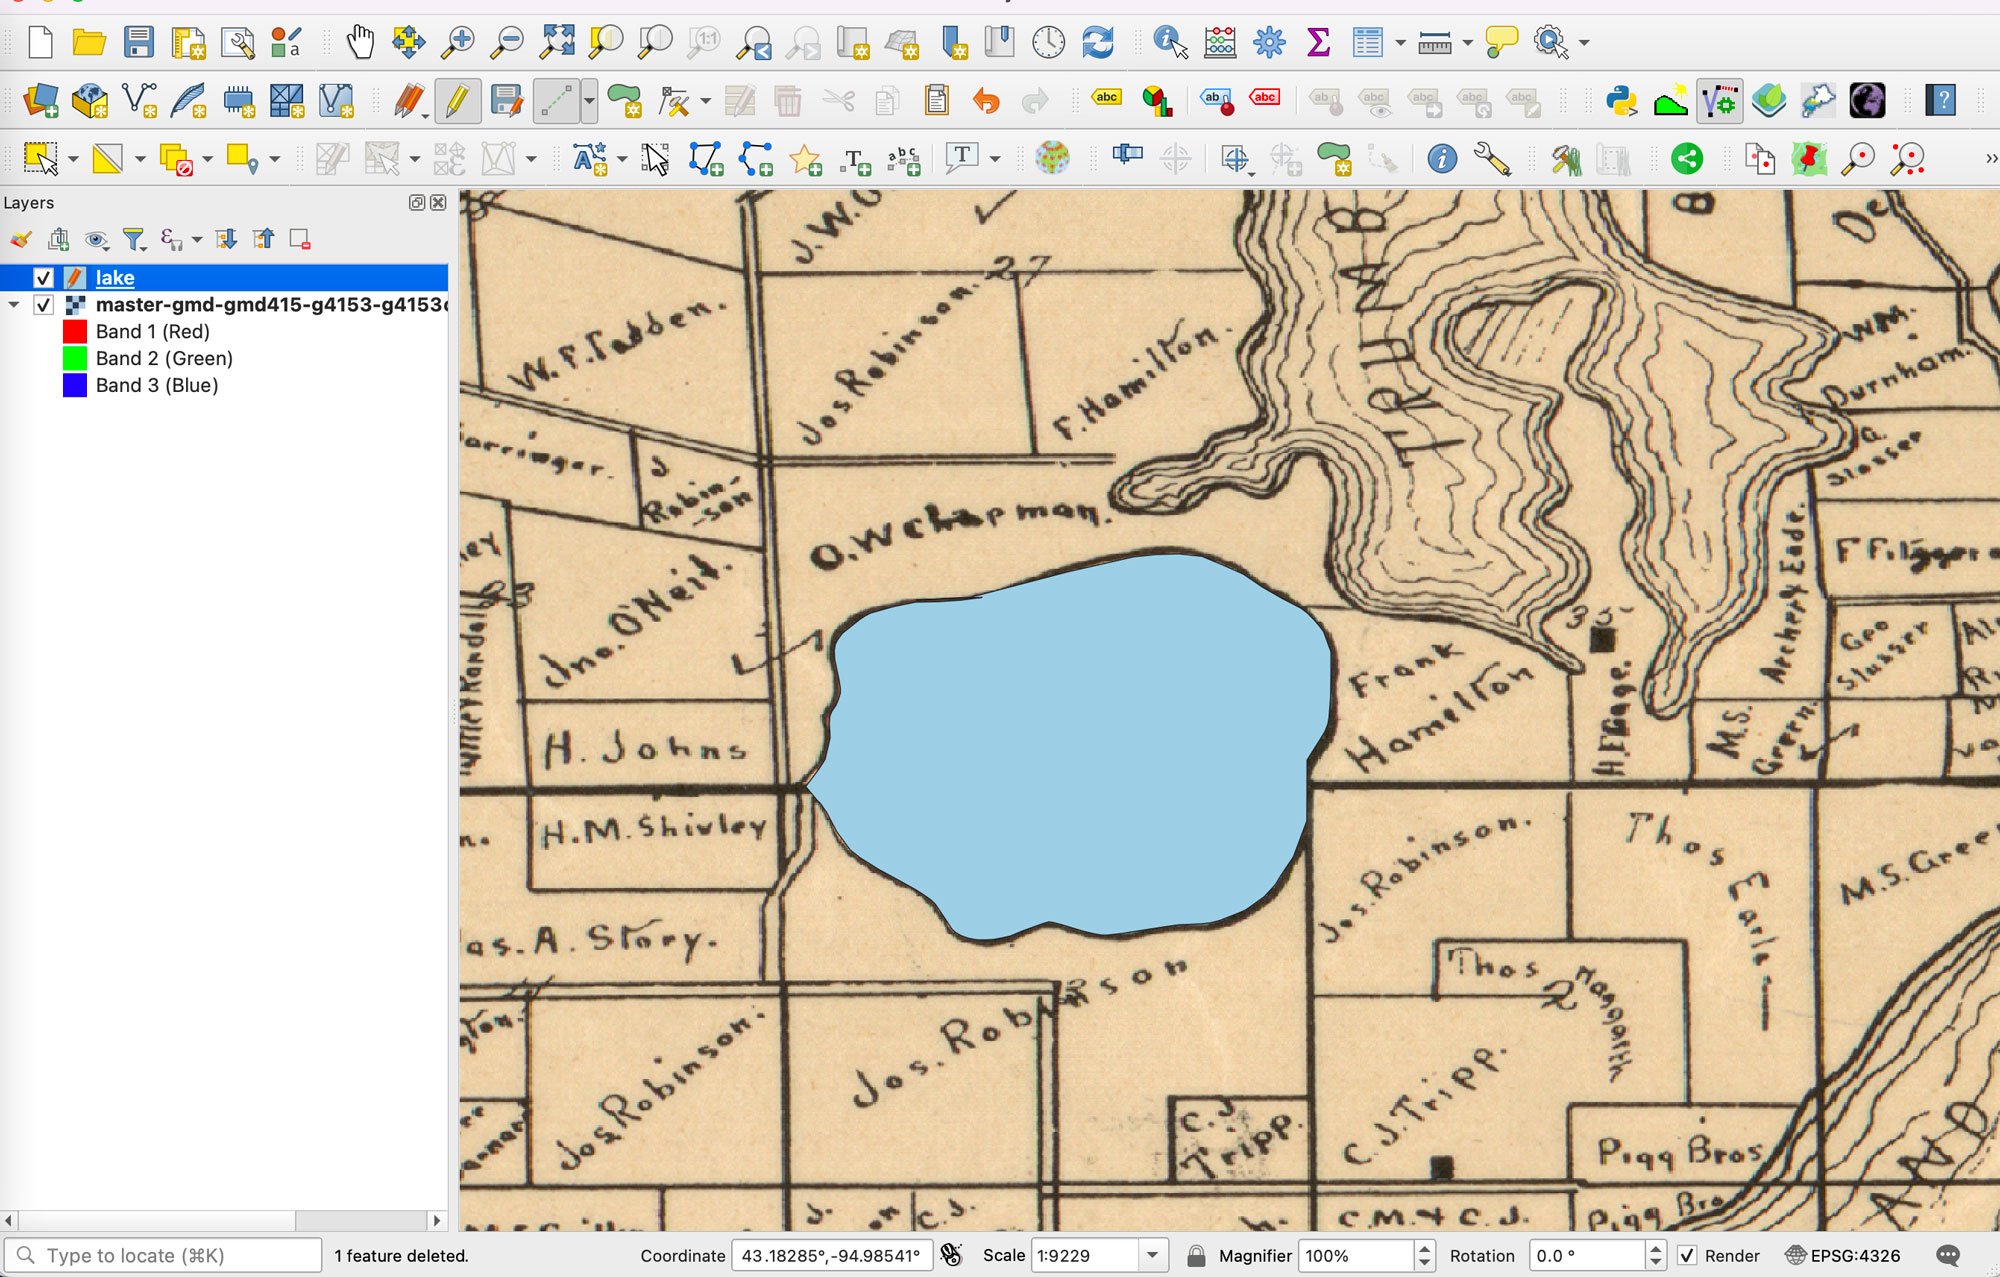
Learn How to Georeference a Map in QGIS Using GIS Data
Learn how to georeference scanned maps in QGIS using reference GIS data and control points when no coordinate grid is available.

The Coastline Paradox: Why Measuring Coastlines isn’t that Simple
The coastline paradox is the concept that the measured length of a coastline will change depending on the scale of the GIS data used for the measurement.

Change Detection Using Kernel Density Analysis in ArcGIS Pro
This GIS tutorial provides step-by-step instructions for how to use two point datasets to detect changes in ArcGIS Pro using kernel density.

Teaching GIS to Kids to Help Them Learn Spatial Skills
Tips and resources to help you get started with teaching your children about GIS and mapping.

Georeferencing Scanned Maps in QGIS Using Graticules
This GIS tutorial teaches you how to assign geographic coordinates to a scanned map in QGIS using a process known as georeferencing.

Using interpolation to create a surface layer with contours in QGIS
This GIS tutorial shows you how to find elevation data points and create a surface layer and contours using QGIS.

GIS User Groups in the United States
GIS user groups are a great way to network with other GIS professionals on a local level. GIS user groups commonly are organized at the regional level.

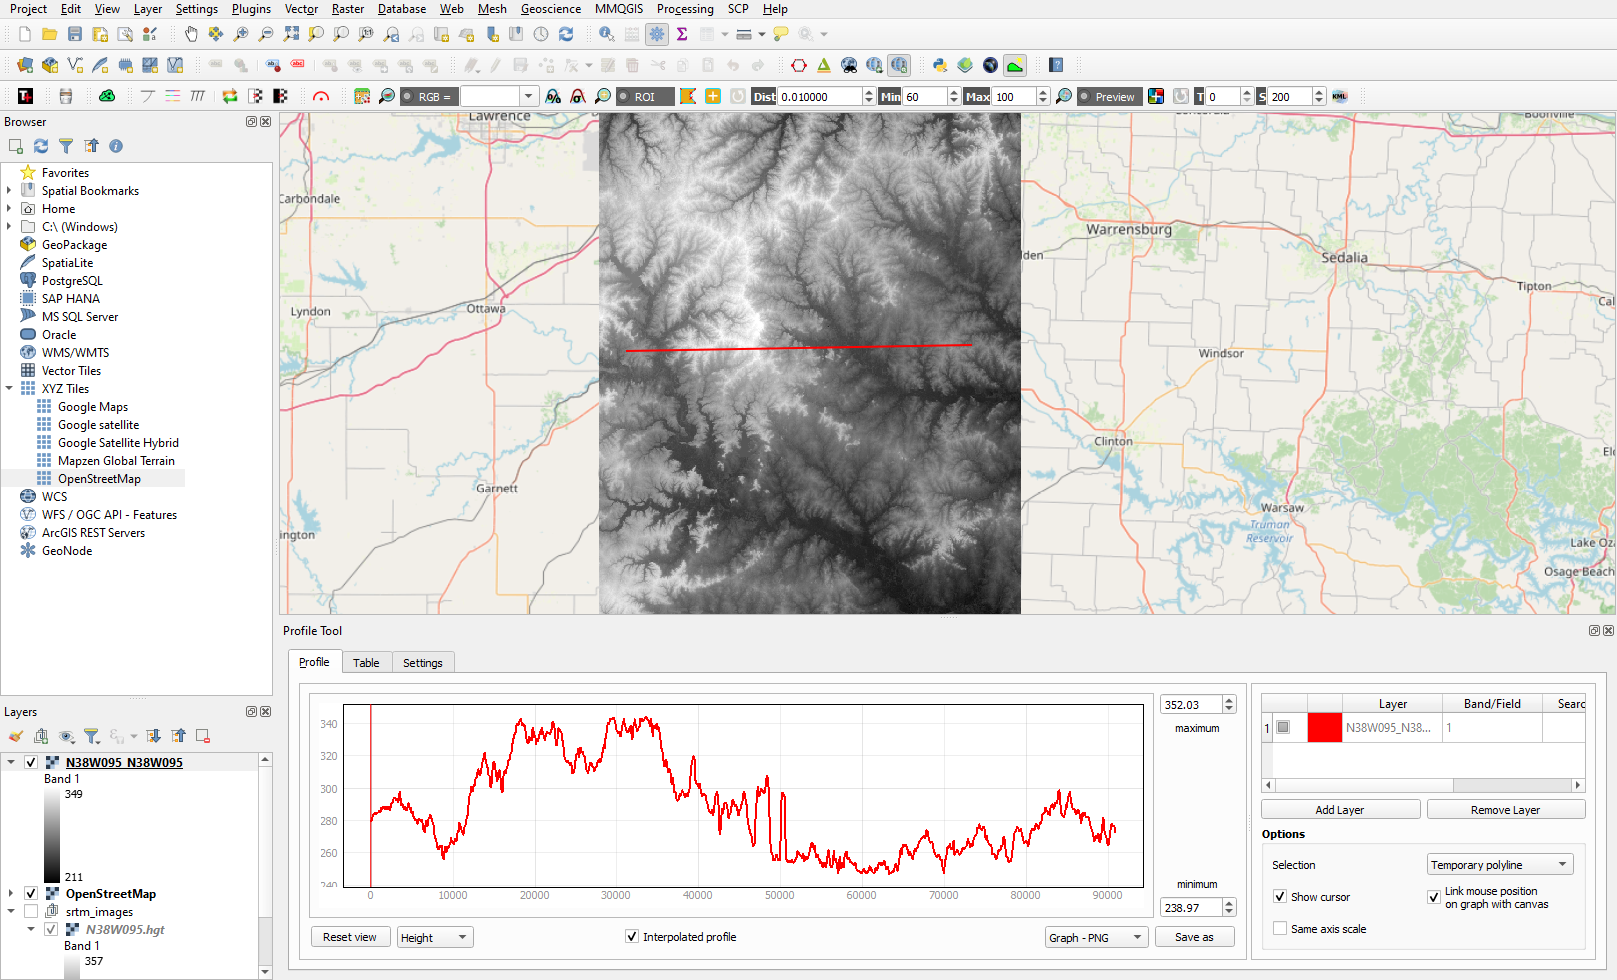
Creating Elevation Cross-Section Profiles with QGIS
Learn to create elevation cross-sections in QGIS with the Profile Tool plugin and SRTM elevation data.

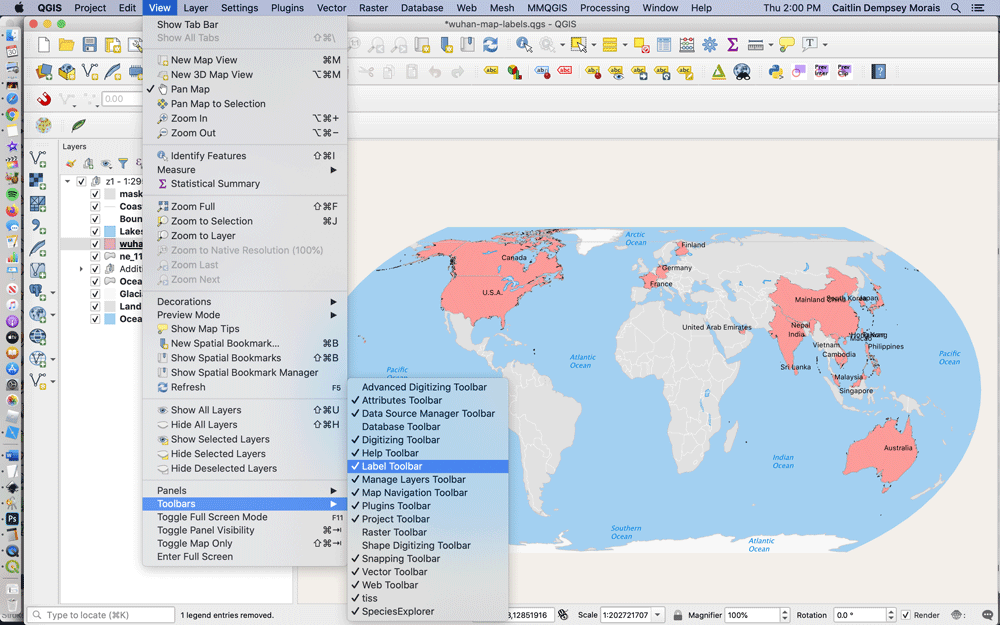
How to Create Isochrone Maps in QGIS
Learn how to create isochrone maps in QGIS to visualize travel times, find the fastest and shortest routes, and analyze accessibility.

Getting Started with the ArcGIS Business Analyst Web App
This GIS tutorial provides a brief introduction to using the ArcGIS Business Analyst Web App.
GIS Tutorials
Online GIS tutorials from Geography Realm for mapping and data analysis.

GEDI: A Tool for Forest Carbon Maps
The GEDI satellite system is being used to map forest carbon content and assess forest biodiversity and health.
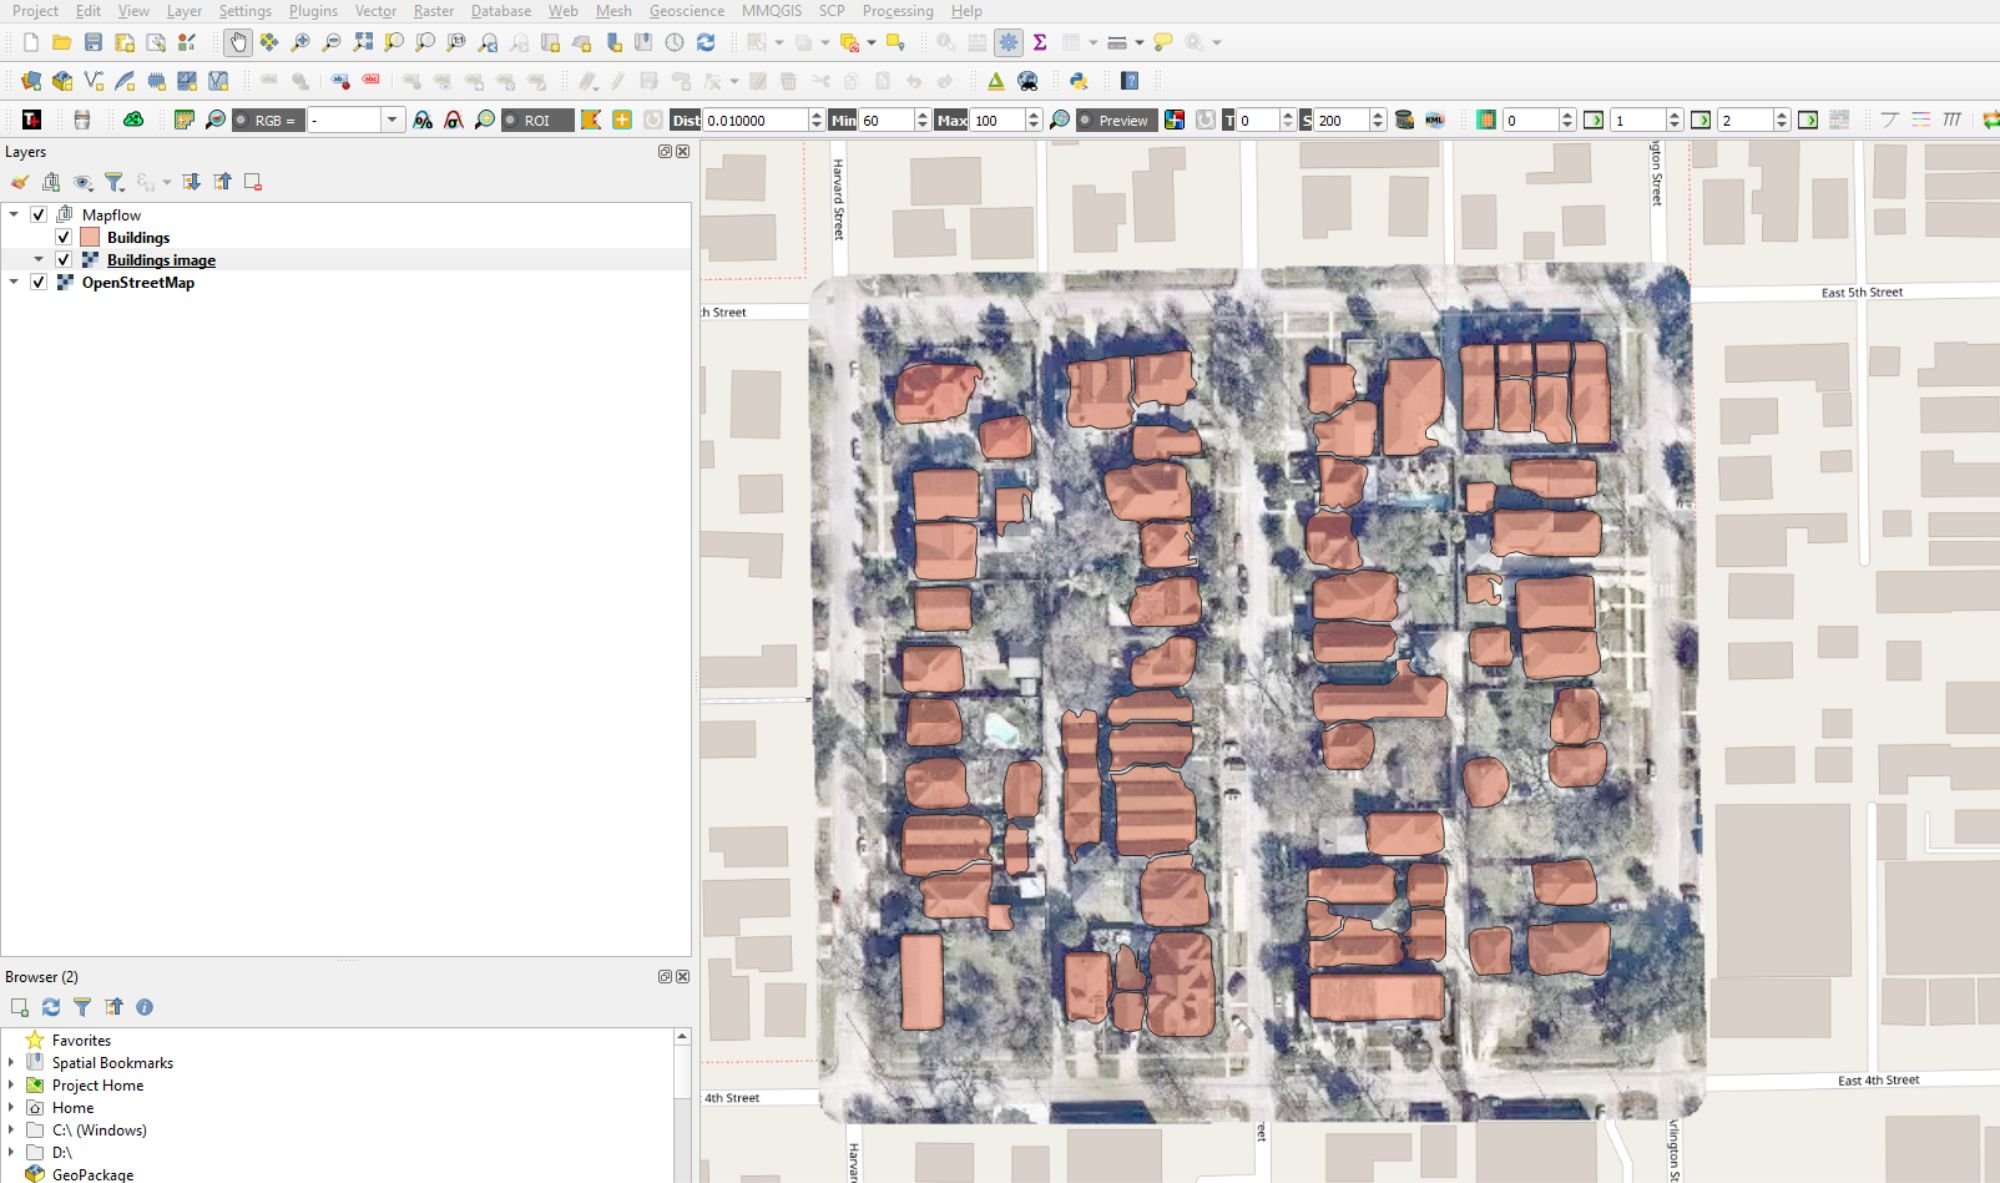
Automatic Digitizing of Imagery Using QGIS
This QGIS tutorial takes you step-by-step through the process of automatically digitizing building footprints using the Mapflow plugin and OpenStreetMap aerials.
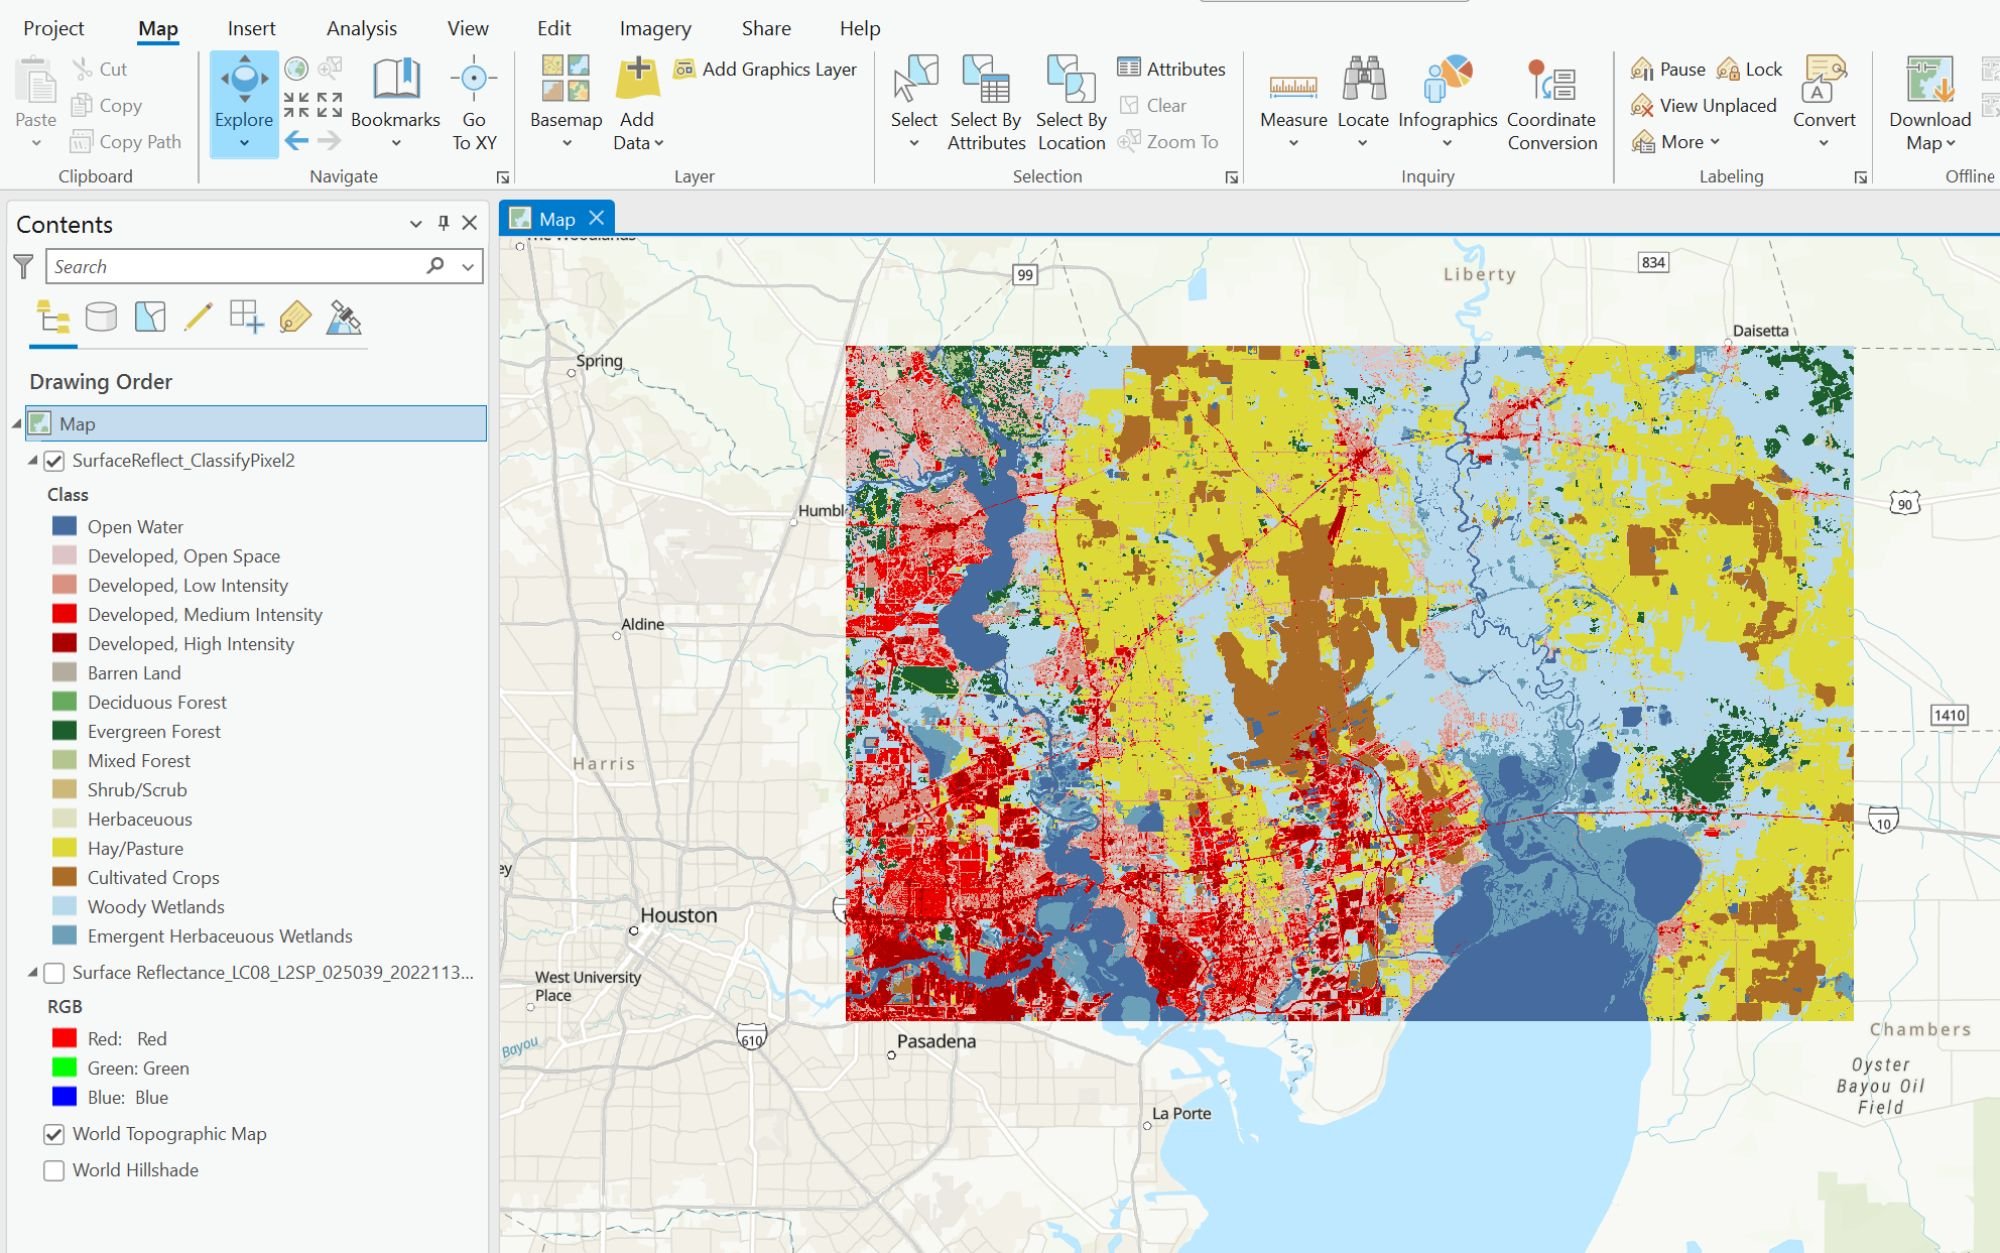
Using Deep Learning to Map Land Cover in ArcGIS Pro
This GIS tutorial provides step-by-step instructions on how to use deep learning models and Landsat 8 satellite imagery in ArcGIS to classify land cover.
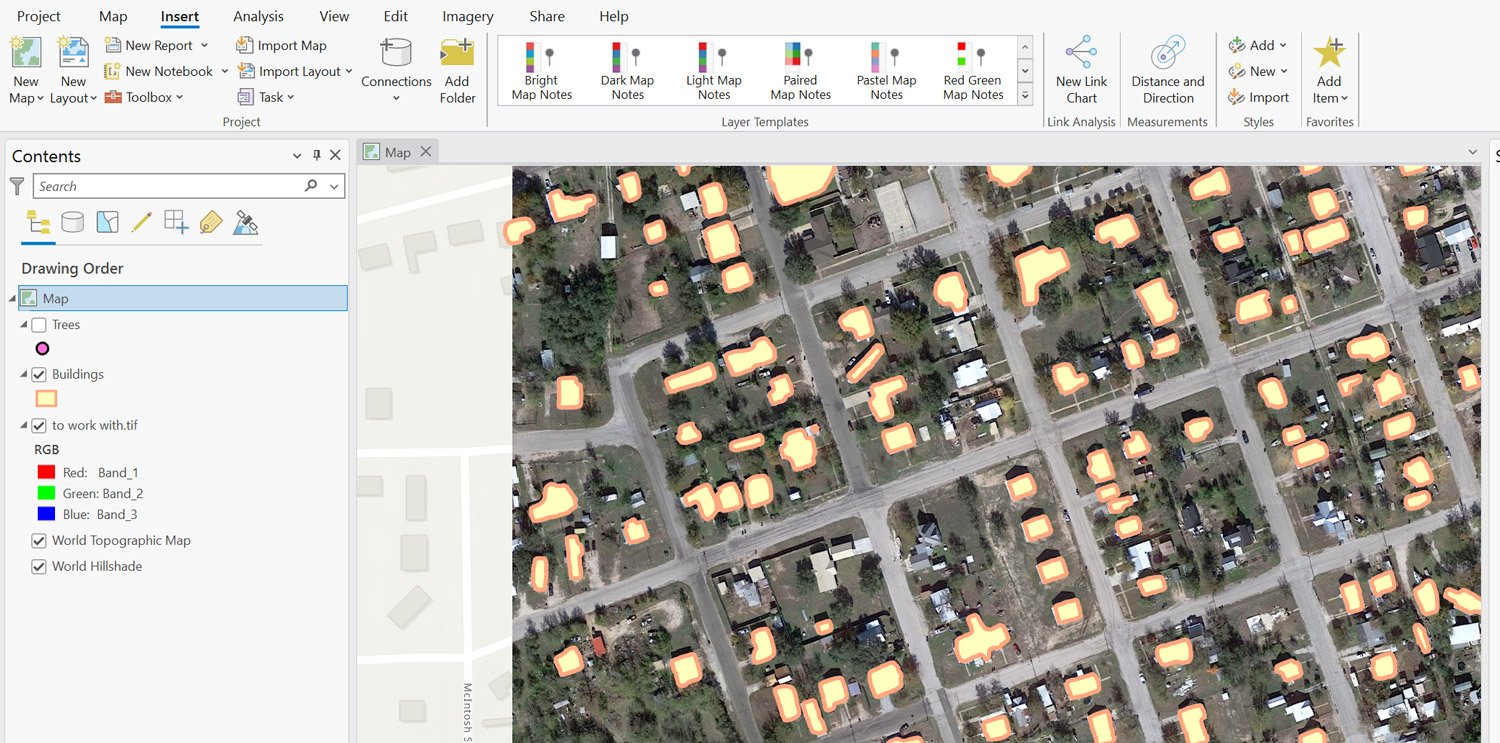
Extracting Building Footprints and Trees from Imagery Using ArcGIS Pro
This tutorial teaches you how to extract trees and building footprints from satellite imagery using ArcGIS Pro.

What is PostGIS?
PostGIS is an Open Geospatial Consortium (OGC)-compliant software that serves as an extension for PostgreSQL, an object-relational database.

Mapping Wildfire Movement
The Fire Events Data Suite is being used to map near real-time wildfire behavior including fire perimeters, active front, and total burned areas.

Analemma: The Sun’s Pattern in the Sky
Analemmas are diagrams and photographs that show the changing position of the Sun and the Earth's moon over the course of a year.

Mapping Earthquakes with ArcGIS Pro
This step-by-step tutorial shows you how to use USGS data and ArcGIS Pro to map earthquakes and geological faults.

Create a Bathymetric Map Using ArcGIS Pro
This step-by-step GIS tutorial shows you how to create a bathymetry map using ocean data from GEBCO.

Mapping Buildings in 2.5D Using ArcGIS Pro
Learn how to find and use building footprint data from OpenStreetMap to create a 2.5D map in ArcGIS Pro.