
Articles

3D Model of the Movement of Carbon Dioxide Through Earth’s Atmosphere
NASA has created a model of the way carbon dioxide moves through Earth’s atmosphere.
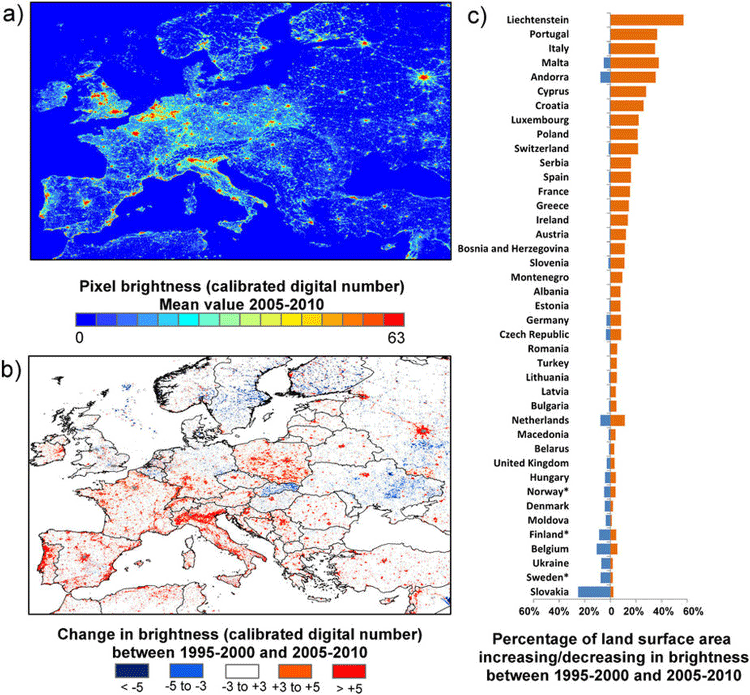
How Geospatial Technologies Are Being Used to Study Light Pollution
Spatial technologies, including remote sensing and GIS, have been used to monitor light pollution and its associated degradation effects.

Jason-2 Satellite to Help Improve Maps of Sea Floor
Jason-2 will be collecting data about the sea floor every 5 miles, which will be used to create a high-definition estimate of the average surface height of the ocean in various places around the globe.

You Can Help the Humanitarian OpenStreetMap Team With Its Research on Crowdsourced Damage Assessment
The Humanitarian OpenStreetMap Team recently launched three formal research experiments on crowdsourced damage assessment and is seeking volunteers interested in participating.

One of the Largest Atlases in the World is Accessible Online
One of the largest atlases in the world, the Klencke Atlas dating from the 1660s, was digitized by the British Library and is now viewable online.

Tree Migration Direction Affected by Climate Change
Ecologists have found that climate change, as it changes precipitation levels and temperatures, is causing trees to grow in different locations than they have traditionally taken root.

A Jet Stream in the Middle of the Earth
Researchers from the University of Leeds published an article in the journal Nature GeoScience with data gathered by the Swarm satellites that reveals the existence of a molten core jet stream using changes in the magnetic field.

Noise Pollution and Geography
Noise pollution has long been seen to be particularly acute in regions where transportation and urban development are most pronounced; the disciplines of urban and environmental geography have focused on this topic.

This Map Lets You Find the Best Cloud-Free Location to View the 2017 Solar Eclipse in the United States
This year a total solar eclipse will occur on August 21st, and will be visible from many states in the United States. The total solar eclipse will be visible in a path from Oregon to South Carolina.
Measuring Vegetation from Satellite Imagery with NDVI
Normalized difference vegetation index (NDVI) is a remote sensing technology that measures vegetation kinds and growth by measuring vegetation fingerprints.

GIS and Stratified Heterogeneity
A method to measure uneven distribution of landscape or population features in a given space is stratified heterogeneity.

Landlocked Countries
Learn about how many countries are landlocked, which is the largest landlocked country, and which two countries are double landlocked.

Coral Bleaching of the Great Barrier Reef
The Great Barrier Reef has undergone two severe bleaching events in successive years. This has been caused by the warming of the oceans due to climate change.

GIS and Digital Humanities
GIS significantly influences digital humanities with a spatial focus, increasingly important for various humanities scholars.

Knowing Geography Makes You More in Favor of Diplomacy
An increase in knowledge of global geography helps put into perspective greater events occurring around the world and makes the person more likely to favor diplomacy.

OpenRouteService’s ‘Quiet Routing’ Creates a Less Stressful Route for Pedestrians
Prof. Dr. Alexander Zipf introduces OpenRouteService's experimental routing option 'Quiet Routing' which guides pedestrian travel around noisy urban areas.

Information Services and the User Experience in the Geographic Information Community
Members of the geographic information community can be considered heavy users of information services. Geographic information (GI) users are “super-encounterers” ...
Information Needs and Information Seeking Behavior Within the Geographic Information Community
As part of the Professional and Occupational information community category (Hansen 2014), members of the geographic information community can be ...

The Geographic Information Community
At its broadest definition, the geographic information community (GIC) is a community of users who are connected by the common interest in visualizing and analyzing spatial (or geographic) information.

Dress Up Your QGIS Install With this Whimsical Plugin
The QGIS hats plugin is a bit of fun that accomplishes no other purpose than to add a hat to the QGIS icon.

These Two ArcGIS Books are Free from Esri
Esri offers two free ArcGIS books: '10 Big Ideas about Applying The Science of Where' & 'Instructional Guide for The ArcGIS Imagery Book'.

How to Make a Map in Excel Using the 3D Map Add-in
This tutorial by Nick Williams provides an overview of how to create a map in Excel using 3D Map for Excel 2016 (or Power Map for Excel 2013).

Teaching Math with GIS
GIS has enormous potential to be used for teaching mathematics to students.

The Role of GIS in Wildlife Research and Conservation
Monitoring and studying wildlife habitats has long been a key focus within GIS.

Model Predicts Economic Damage from Climate Change to be Greatest in the South in the US
A new model maps out the agriculture, crime, coastal storms, energy, human mortality, and labor costs of climate change in the United States.

By Using High-resolution Satellite Imagery to Survey Drylands, Researchers Boosted Estimates of Global Forest Cover by 9%
Researchers, using high-resolution satellite imagery, have discovered there is about 40-47% more forest cover in dryland biomes than previously thought.